 English
  Русский
 Bahasa Indonesia
 Bahasa Malay
 ไทย
ไทย Español
 Deutsch
 Български
 Français
 Tiếng Việt
 中文
中文 বাংলা
বাংলা हिन्दी
 Čeština
 Українська
 Română

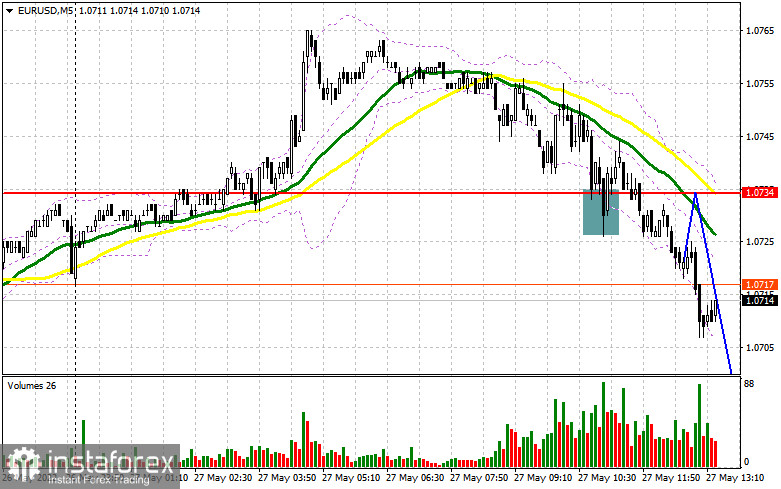
In the morning article, I highlighted the level of 1.0743 and recommended taking decisions with this level in focus. Now let's look at the 5-minute chart and try to figure out what actually happened. The euro quickly returned to the support level. of 1.0743. However, after the first test of this level, the bulls tried to regain control with the help of a false breakout. They were hoping to facilitate further growth. As a result, a buy signal appeared but the upward movement was rather limited. After another test of 1.0743, the pair dipped below this level. I did not see an upward test of this level. For this reason, I did not open short positions after a drop although I mentioned it in my outlook for the European session.
What is needed to open long positions on EUR/USD
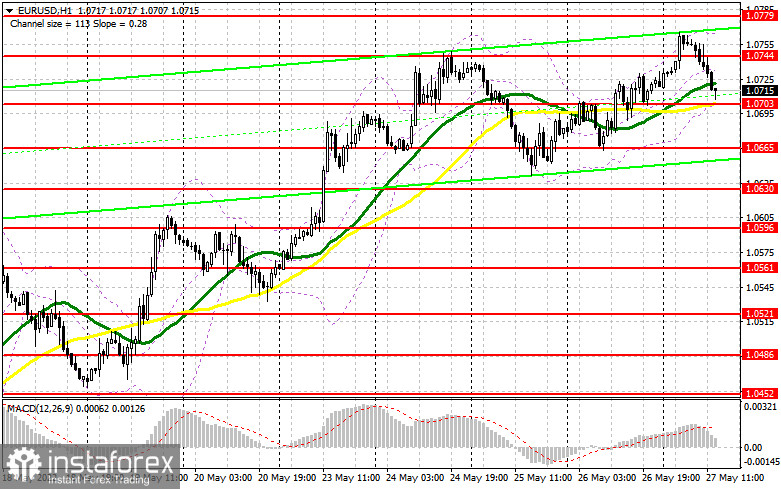
As traders are expecting a batch of economic reports in the second half of the day, the euro/dollar pair is likely to decline. Therefore, EUR bulls should brace for bearish pressure. The trajectory will depend on US monthly household expenses data as well as on the University of Michigan Consumer Sentiment Index. If the pair drops to 1.0703 after the release of the reports, the optimal scenario for purchases will be a false breakout of 1.0703. It will give an excellent buy signal within the bullish trend. The pair may recover to the 1.0744 level formed in the morning. A breakout and a downward test of this level will give a new signal for entering long positions. It may also open the path to a new high of 1.0779 where I recommend locking in profits. A more distant target will be the 1.0811 level. If EUR/USD decreases and bulls show no activity at 1.0703, it is recommended to refrain from opening long positions. This scenario looks likely as in case of upbeat US macro stats, the bulls start closing long positions more actively at the end of the week. I would advise you to wait for a false breakout near the low of 1.0665. It is also possible to open long positions immediately at a bounce from the level of 1.0630 or even a low around 1.0596, keeping in mind an upward intraday correction of 30-35 pips.
What is needed to open short positions on EUR/USD
In the case of an upward correction of the pair after the morning decline, a false breakout at 1.0744 will signal short positions against the trend. The price is likely to slide to the support level of 1.0703, a new level formed in the morning. If US macro stats are positive, especially monthly household expenses data, bulls and bears will tussle for 1.0703. Therefore, if the sellers take control over this level and there is an upward test, a sell signal will appear. It may erase the buyers' stop orders, triggering a sharp downward movement to the 1.0665 level. I recommend locking in profits at this level. A more distant target will be the 1.0630 level. However, bears should try really hard if they want to push the pair to this level amid risk appetite. If EUR/USD rises in the afternoon and bears show no energy at 1.0744 as yesterday after the release of weak US data, the uptrend will continue. It will also cement bullish bias. If so, it is better to open short positions after a false breakout of 1.0779. You can sell EUR/USD at a bounce from 1.0811 or even a high around 1.0844, keeping in mind a downward intraday correction of 30-35 pips.
COT report
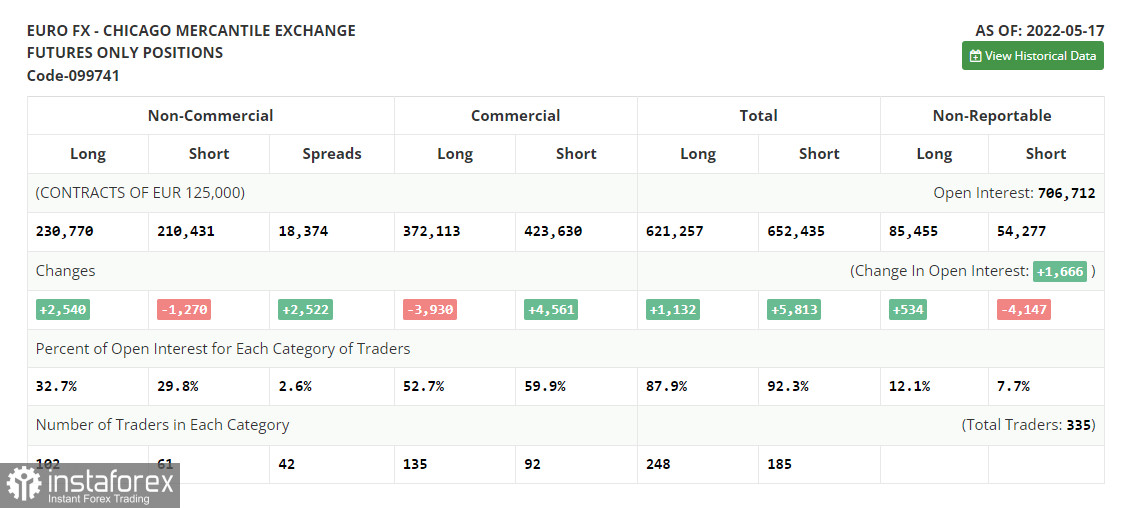
The COT report (Commitment of Traders) for May 17 logged a further increase in long positions and a decline in short ones. Traders are buying the asset at a rather low price amid the ECB's announcements about the upcoming key interest rate hike. Last week, various ECB policymakers confirmed this intention. The ECB is expected to hike the interest rate by a quarter-point in July this year, then in September and in December, raising it eventually to 0.25% by the end of the year. However, some European politicians are criticizing this plan. They are calling for more aggressive measures from the ECB to combat surging inflation. The interest rate is likely to be raised in September and December to 0.5% from the current zero level. The upward trend of the euro may be fueled by rumors that the Fed may slacken its monetary policy tightening in September after aggressive rate hikes in spring and summer. The COT report revealed that the number of long non-commercial positions increased by 2,540 to the level of 230,770 from the level of 228,230. The number of short non-commercial positions dwindled by -1,270 to the level of 210,431 from the level of 211,701. As I have mentioned more than once, the weaker euro is more attractive to traders. An upward reversal has only proved it. At the end of the week, the total non-commercial net position advanced to 20,339 against 16,529 a week earlier. The weekly closing price almost also climbed slightly and amounted to 1.0556 against 1.0546.
Signals of technical indicators
Moving averages
EUR/USD is trading near 30- and 50-period moving averages, which indicates market uncertainty.
Remark. The author is analyzing the period and prices of moving averages on the 1-hour chart. So, it differs from the common definition of classic daily moving averages on the daily chart.
Bollinger Bands
In case of a decline, the lower border around 1.0703 will act as support.
Definitions of technical indicators
- Moving average recognizes an ongoing trend through leveling out volatility and market noise. A 50-period moving average is plotted yellow on the chart.
- Moving average identifies an ongoing trend through leveling out volatility and market noise. A 30-period moving average is displayed as the green line.
- MACD indicator represents a relationship between two moving averages that is a ratio of Moving Average Convergence/Divergence. The
- MACD is calculated by subtracting the 26-period Exponential Moving Average (EMA) from the 12-period EMA. A 9-day EMA of the MACD called the "signal line".
- Bollinger Bands is a momentum indicator. The upper and lower bands are typically 2 standard deviations +/- from a 20-day simple moving average.
- Non-commercial traders - speculators such as retail traders, hedge funds, and large institutions who use the futures market for speculative purposes and meet certain requirements.
- Non-commercial long positions represent the total long open position of non-commercial traders.
- Non-commercial short positions represent the total short open position of non-commercial traders.
- The overall non-commercial net position balance is the difference between short and long positions of non-commercial traders.