 English
  Русский
 Bahasa Indonesia
 Bahasa Malay
 ไทย
ไทย Español
 Deutsch
 Български
 Français
 Tiếng Việt
 中文
中文 বাংলা
বাংলা हिन्दी
 Čeština
 Українська
 Română

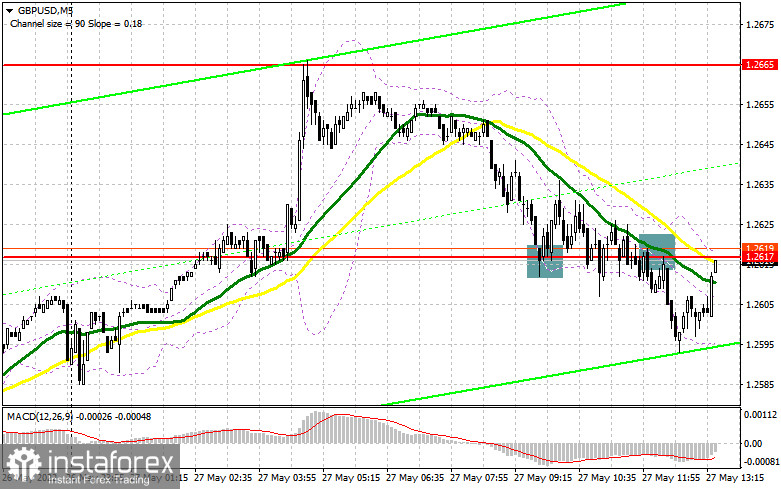
In my forecast this morning, I drew your attention to the level of 1.2617 and recommended entering the market from it. Let's have a look at the 5-minute chart and analyze where and how to enter the market. The decline and formation of the false breakout at 1.2617, against the background of the lack of important fundamental statistics, was not surprising. That created a good sell signal, but after the pair gained almost 20 pips, the pressure returned, and we saw the price testing 1.2617. As a result, the trade closed to the breakeven, and I waited for other signals. The pair fixed below 1.2617 and this gave the sell signal. However, I did not open short positions, as it was difficult to imagine what direction the pair would choose during such choppy trading. There was no distinct trend in the pair, so it had equal chances to go up or down. The pound has fallen down by 20 pips, but by the time of writing the article, it managed to recoup this downturn. Considering all the above, I decided to revise the technical picture.
Long positions on GBP/USD:
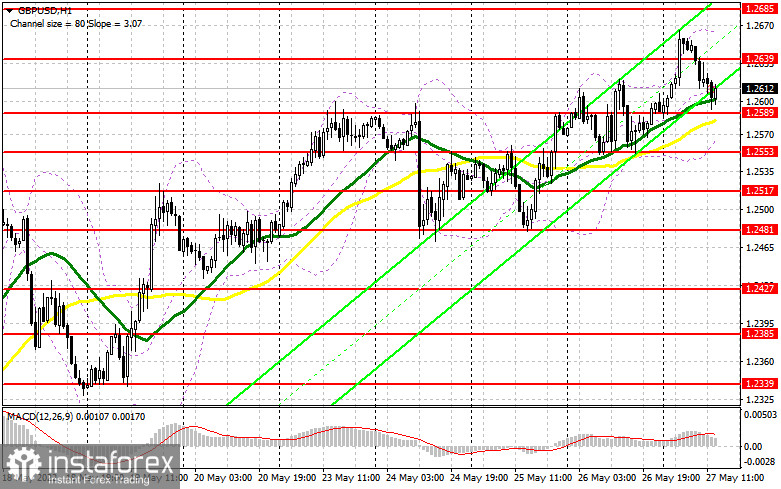
Currently, nothing threatens the pound's uptrend. Even if the pair declines below 1.2589, which is the bears' target now, nothing bad will happen. Quite a lot of fundamental statistics in the US may push the pound to test 1.2589. Only a false breakout at that level may give a signal for opening long positions with an aim to continue the bullish rally and reach the resistance of 1.2639. Weak data on personal spending and incomes in the US, as well as a sharp decline in the consumer sentiment index and the inflation expectations index from the University of Michigan, are needed for such a scenario. If bears show weak activity near 1.2639, the pair may surge. However, only after fixing above 1.2639 with the reverse top/bottom test, it is possible to open long positions with growth prospects to 1.2685 and hit 1.2722, where traders may lock in profits. The next target is located in the area of 1.2765. If the pound declines, bulls are weak at 1.2589, and the US data does not meet the forecasts, bulls may give up, and this is likely to increase pressure on the pair. Therefore, I would not recommend rushing to buy the pound. It is better to enter the market after a false breakout near 1.2553. You can also buy the pound on a rebound from 1.2517, or even lower near 1.2481, allowing an intraday correction of 30-35 pips.
Short positions on GBP/USD:
As can be seen on the chart, bears are gradually pushing the price to their targets and now they are counting on a breakthrough of 1.2589. I will also bet on a larger downward correction in the pair, so I am waiting for the appropriate sell signals. The release of the US data may be a reason for the pound to rise, as it promises weak readings. Therefore, a false breakout at 1.2639 may become a more suitable signal to open short positions. A breakthrough and a reverse bottom/top test of 1.2589 is likely to form an additional signal for the opening of short positions, which will quickly return the pound to the area of 1.2553, opening a direct way to 1.2517, where traders can take profits. The next target is located in the area of 1.2481, which is this week's low and a major support level. However, it is unlikely that this scenario will come true without good fundamental statistics in the US today. With the GBP/USD growth scenario and lack of activity at 1.2639, it is better to postpone opening short positions until the pair reaches the next major resistance at 1.2685. You can also open short positions there only in case of a false breakout. Selling the pound on the rebound can be possible from the high of 1.2722, counting on a pair's intraday downtrend by 30-35 pips.
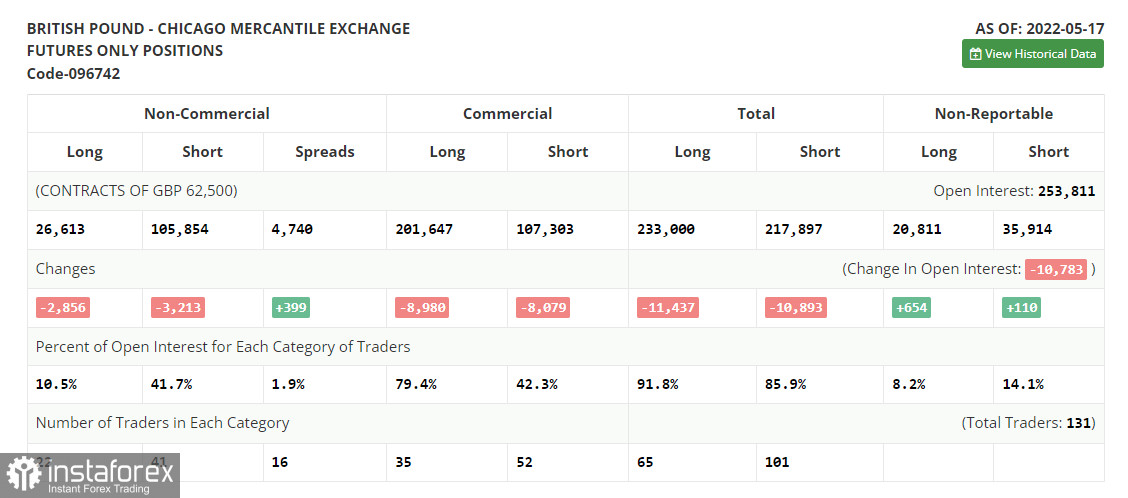
The COT (Commitment of Traders) report for May 17 logged a reduction of both long and short positions. However, short positions declined significantly. This suggests that the market may be gradually approaching the bottom and that traders appreciate quite attractive prices and despite the whole situation in the UK and the uncertainty, they are gradually taking a closer look at the market. Notably, the UK economy has a number of problems. Quite a difficult situation with inflation and slowing economic growth makes the Bank of England feel pressure from both sides. Even despite all the above, Governor of the Bank of England Andrew Bailey in a recent interview noted that the regulator was not going to give up raising interest rates in the near future. One can no longer say the same about the Federal Reserve's policy. There are rumors that the central bank is planning to "pause" the interest rate hike cycle as early as September this year, which is bound to have a negative impact on the US dollar and weaken the currency. The May 17 COT report showed that long non-commercial positions declined to 26,613 by 2,856, while short non-commercial positions declined to 105,854 by 3,213. This led to a decrease in the negative non-commercial net position to -79,241 from -79,598. The weekly closing price rose to 1.2481 from 1.2313.
- Moving average defines the current trend by smoothing out volatility and noise. Period 50. Marked in yellow on the chart.
- Moving average defines the current trend by smoothing out volatility and noise. Period 30. Marked in green on the chart.
- MACD (Moving Average Convergence/Divergence) indicator Fast EMA of period 12. Slow EMA period 26. SMA period 9
- Bollinger Bands. Period 20
- Non-commercial traders are speculators, such as individual traders, hedge funds, and large institutions, which use the futures market for speculative purposes and meet certain requirements.
- Long non-commercial positions represent the total long open position of non-commercial traders.
- Short non-commercial positions represent the total short open position of non-commercial traders.
- Total non-commercial net position is the difference between the short and long positions of non-commercial traders.