 English
  Русский
 Bahasa Indonesia
 Bahasa Malay
 ไทย
ไทย Español
 Deutsch
 Български
 Français
 Tiếng Việt
 中文
中文 বাংলা
বাংলা हिन्दी
 Čeština
 Українська
 Română

Analysis of Friday's deals:
30M chart of the EUR/USD pair
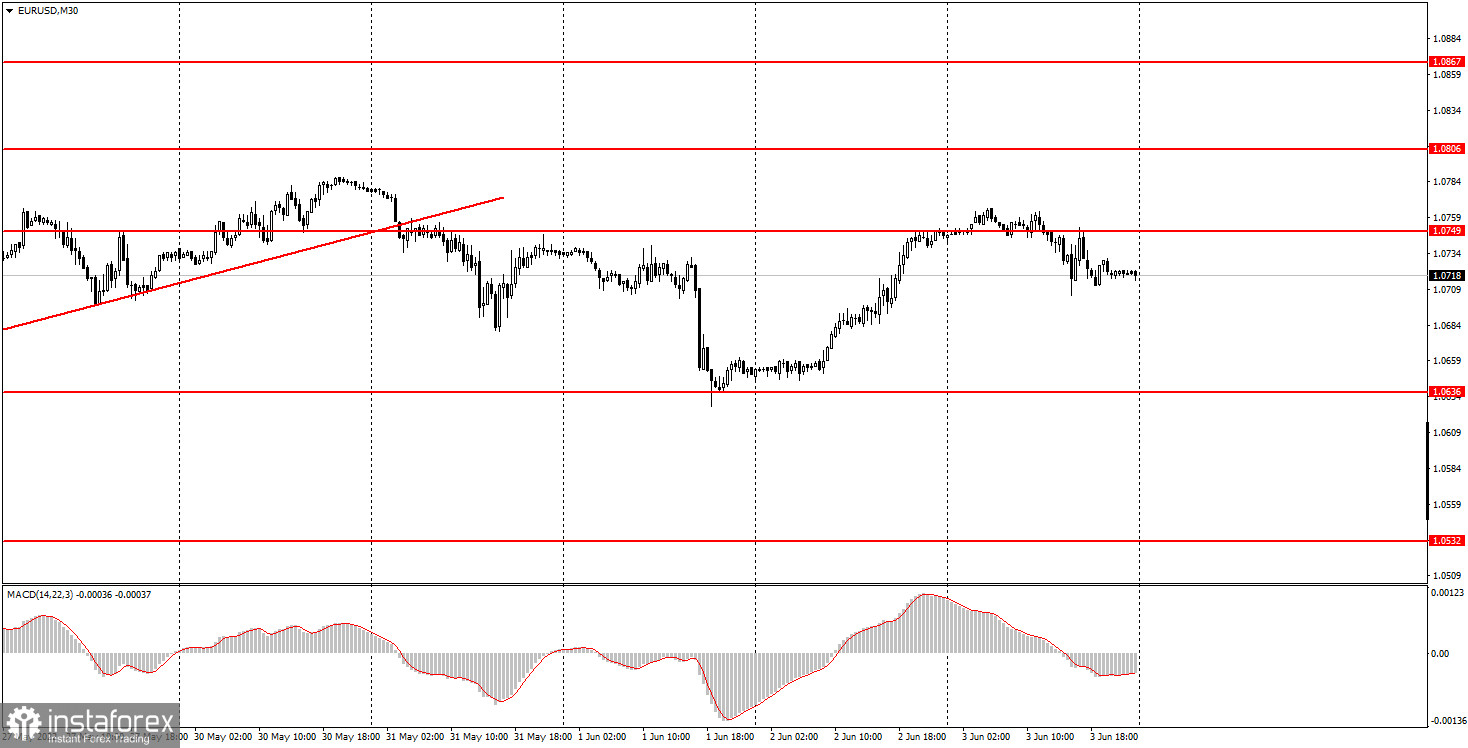
The EUR/USD currency pair tried to start a new round of downward movement on Friday, but even on the 30-minute timeframe it is clearly visible that recently all of the pair's movements took place in a very limited price range. Thus, Friday's movement can't really be attributed to either a downward trend or an upward trend. The volatility of the day was low - only about 60 points, which is very low, given the macroeconomic background. The most important US NonFarm Payrolls report was published on Friday, which usually always provokes a strong market reaction. It provoked this time as well, but it was rather weak, as for the published value for May. The forecast of 200-300,000 new jobs outside the agricultural sector was exceeded by at least 125,000, so the dollar should have received tangible market support. It did receive support, but was not tangible. We believe that the dollar will continue to strengthen on Monday, as the European market did not have the opportunity to work out this report on Friday. In any case, the level of 1.0749 has not been overcome, so a fall is more likely than an increase right now.
5M chart of the EUR/USD pair
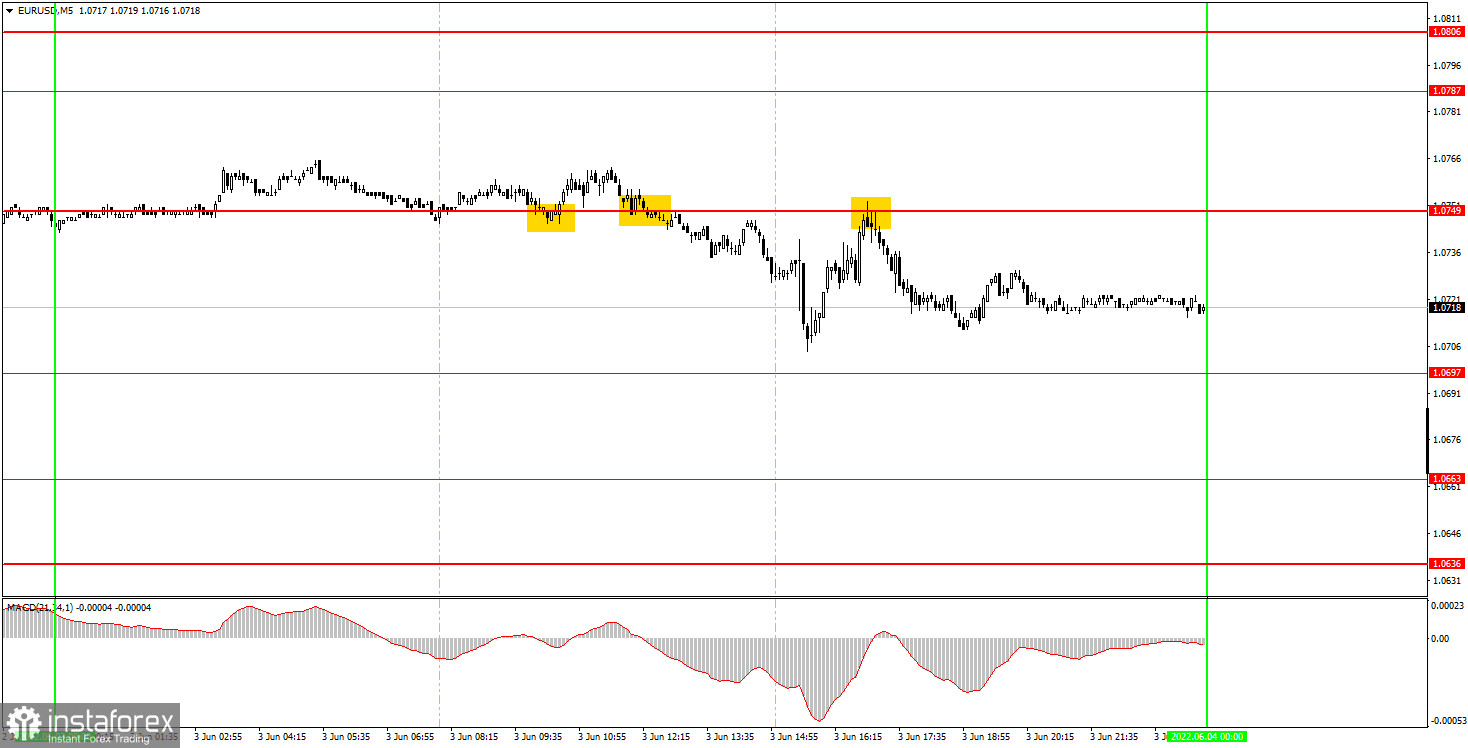
The technical picture on the 5-minute timeframe does not look good. If the movement was still relatively calm during the European trading session, then the "swing" began on the US one. In total, three trading signals were generated, and two of them could bring profit to novice traders. The first signal to buy in the form of a rebound from the level of 1.0749 turned out to be false, and the price did not move even 10 points in the right direction. Therefore, the deal closed at a small loss. The second sell signal was stronger and the pair went down about 40 points, just short of reaching the target level of 1.0697. The third signal to sell also provoked a movement of 35 points. Thus, it was possible to earn 30 points on two short positions. On the first short position, most likely, Stop Loss was triggered at breakeven, and the second should have been closed manually in the evening and at that time it was in profit of about 30 points.
How to trade on Monday:
The ascending trendline is no longer relevant on the 30-minute timeframe and there is no trend right now. Formally, the trend is downward, as the trend line has been overcome, but we see that the pair failed to show a significant fall this week. There is no new trend line now either. We believe that a strong Nonfarm report and a rebound from 1.0749 will lead to lower quotes on Monday. On the 5-minute TF, it is recommended to trade at the levels of 1.0607, 1.0636, 1.0663, 1.0697, 1.0749, 1.0787-1.0806, 1.0837. When passing 15 points in the right direction, you should set Stop Loss to breakeven. Neither the European Union nor the United States is scheduled for a single important event or report. Therefore, during the day, novice traders will have nothing to react to. However, we still believe that the European market can work out on the data on the US labor market, which came out on Friday. Accordingly, the strengthening of the dollar is possible.
Basic rules of the trading system:
1) The signal strength is calculated by the time it took to form the signal (bounce or overcome the level). The less time it took, the stronger the signal.
2) If two or more deals were opened near a certain level based on false signals (which did not trigger Take Profit or the nearest target level), then all subsequent signals from this level should be ignored.
3) In a flat, any pair can form a lot of false signals or not form them at all. But in any case, at the first signs of a flat, it is better to stop trading.
4) Trade deals are opened in the time period between the beginning of the European session and until the middle of the American one, when all deals must be closed manually.
5) On the 30-minute TF, using signals from the MACD indicator, you can trade only if there is good volatility and a trend, which is confirmed by a trend line or a trend channel.
6) If two levels are located too close to each other (from 5 to 15 points), then they should be considered as an area of support or resistance.
On the chart:
Support and Resistance Levels are the Levels that serve as targets when buying or selling the pair. You can place Take Profit near these levels.
Red lines are the channels or trend lines that display the current trend and show in which direction it is better to trade now.
The MACD indicator (14,22,3) consists of a histogram and a signal line. When they cross, this is a signal to enter the market. It is recommended to use this indicator in combination with trend lines (channels and trend lines).
Important speeches and reports (always contained in the news calendar) can greatly influence the movement of a currency pair. Therefore, during their exit, it is recommended to trade as carefully as possible or exit the market in order to avoid a sharp price reversal against the previous movement.
Beginners on Forex should remember that not every single trade has to be profitable. The development of a clear strategy and money management are the key to success in trading over a long period of time.