 English
  Русский
 Bahasa Indonesia
 Bahasa Malay
 ไทย
ไทย Español
 Deutsch
 Български
 Français
 Tiếng Việt
 中文
中文 বাংলা
বাংলা हिन्दी
 Čeština
 Українська
 Română

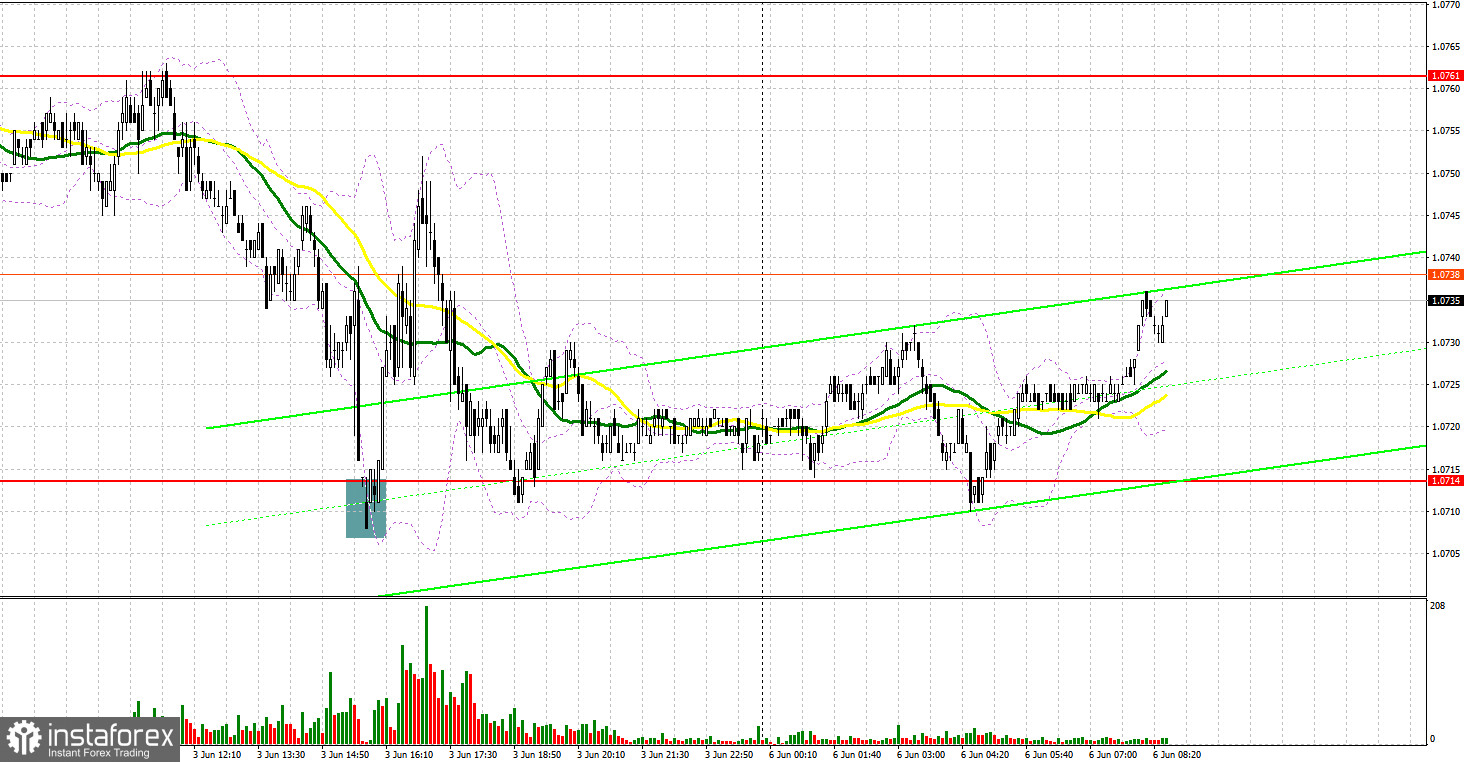
Only one signal was formed to enter the market last Friday. Let's look at the 5-minute chart and see what happened there. Considering that in the first half of the day all the data on the eurozone for the most part coincided with the forecasts of economists, the volatility in the EUR/USD pair was at a rather low level and amounted to about 25 points. This did not allow us to get closer to the designated support and resistance levels, and to form signals for entering the market. During the US session, bulls managed to protect the support level of 1.0714, which was tested after the release of US labor market reports, which led to a buy signal. As a result, the upward movement amounted to about 40 points.
When to go long on EUR/USD:
Last week, data on the US labor market only slightly strengthened the position of US dollar bulls, as they surpassed economists' forecasts. We will not receive fundamental reports today, so euro bulls may get a chance for the pair to continue rising in the short term. In case of a decline, only a false breakout is formed at the level of 1.0711, it creates a signal to open long positions, counting on a more serious upsurge and a return to the intermediate resistance at 1.0750, formed on the basis of last Friday. A breakthrough and test from top to bottom of this range will cause a serious blow to the bears' stop orders, which will form a new signal for entering long positions, with the possibility of updating the monthly high of 1.0785, where I recommend taking profits. It is unlikely that it will be possible to reach a more distant target in the area of 1.0820.
If the EUR/USD declines and there are no bulls at 1.0711, the pressure on the euro will increase. Dismantling bulls' stop orders below this level will push the pair to 1.0673, so the best option for opening long positions would be a false breakout. I advise you to buy EUR/USD immediately on a rebound only from the level of 1.0630, or even lower - in the area of 1.0596 with the goal of an upward correction of 30-35 points within the day.
When to go short on EUR/USD:
As bears did not try to regain control of the market, nothing came of it. Strong US statistics did not help the dollar, and a slight slowdown in the activity of PMI indices, on the contrary, instilled confidence in traders who bet on the growth of risky assets. If the pair grows in the first half of the day, forming a false breakout at the level of 1.0750 creates a signal to open short positions with the prospect of returning to the support of 1.0711 - the level formed on the basis of today's results. Considering that trading is conducted in the area of moving averages, this adds even more uncertainty to the market. A breakthrough and consolidation below 1.0711, as well as a reverse test from the bottom up of this range - all this will lead to another sell signal with the demolition of bulls' stops and a larger movement of the pair down to the 1.0673 area. A breakthrough and consolidation below 1.0673 may take place in the afternoon. In this case, the more distant target will be the area of 1.0630, where I recommend completely exiting short positions.
If EUR/USD moves up during the European session, as well as the absence of bears at 1.0750, the situation will continue to develop on the euro bulls' side. In this case, we can talk about the continuation of the upward trend. The best option would be short positions in forming a false breakout in the area of 1.0785. You can sell EUR/USD immediately on a rebound from the monthly high of 1.0820, or even higher - in the area of 1.0853 with the goal of a downward correction of 30-35 points.
COT report:
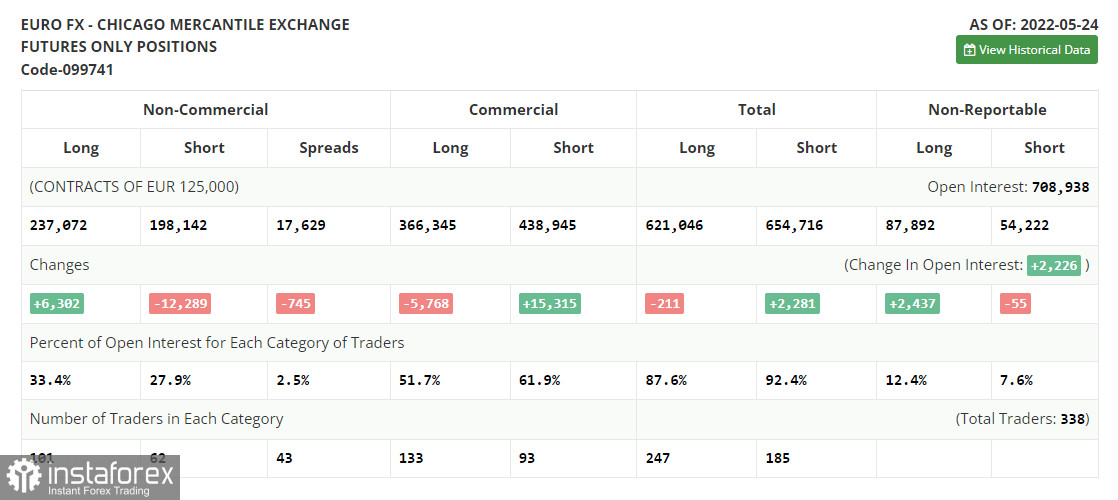
The Commitment of Traders (COT) report for May 24 showed that the number of long positions advanced, whereas the number of short positions dropped. Traders continued opening long positions, expecting a more aggressive monetary policy from the ECB. Although last week, there were less comments about a key interest rate hike in the near future, the euro/dollar pair managed to retain its upward potential. Now, analysts suppose that the ECB will raise the deposit rate by one-fourth of a basis point as early as July. The next two hikes will take place in September and December. By the end of the year, the benchmark rate is expected to be at the level of 0.25%. However, some experts are sure that the central bank will have to take more aggressive measures. A lot depends on the inflation report for May of this year. The indicator may jump to 7.7% on a yearly basis, thus increasing pressure on politicians. Against the backdrop, the central bank may raise the key interest rate up to 0.5% from the current zero level.
The COT report unveiled that the number of long non-commercial positions increased by 6,302 to 237,072 from 230,770, while the number of short non-commercial positions declined by 12,289 to 198,142 from 210,431. The euro's low price is making the currency more attractive for mid-term traders. According to the weekly results, the total non-commercial net position increased to 38,930 from 20,339. The weekly close price jumped to 1.0734 from 1.0556.
Indicator signals:
Moving averages
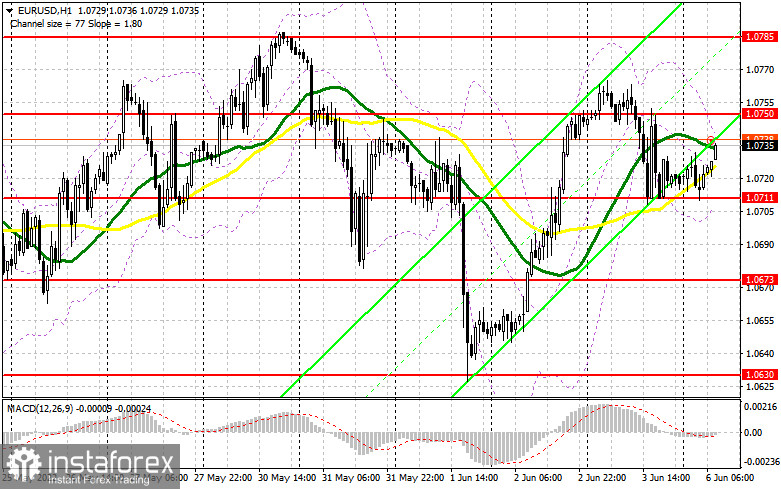
Trading is carried out in the area of 30 and 50-day moving averages, which indicates the sideways nature of the market.
Note: The period and prices of moving averages are considered by the author on the H1 hourly chart and differs from the general definition of the classic daily moving averages on the daily D1 chart.
Bollinger Bands
In the event of a decline, the lower border of the indicator around 1.0711 will act as support. In case of growth, the upper border of the indicator in the area of 1.0740 will act as resistance.
Description of indicators
- Moving average (moving average, determines the current trend by smoothing out volatility and noise). Period 50. It is marked in yellow on the chart.
- Moving average (moving average, determines the current trend by smoothing out volatility and noise). Period 30. It is marked in green on the chart.
- MACD indicator (Moving Average Convergence/Divergence — convergence/divergence of moving averages) Quick EMA period 12. Slow EMA period to 26. SMA period 9
- Bollinger Bands (Bollinger Bands). Period 20
- Non-commercial speculative traders, such as individual traders, hedge funds, and large institutions that use the futures market for speculative purposes and meet certain requirements.
- Long non-commercial positions represent the total long open position of non-commercial traders.
- Short non-commercial positions represent the total short open position of non-commercial traders.
- Total non-commercial net position is the difference between short and long positions of non-commercial traders.