 English
  Русский
 Bahasa Indonesia
 Bahasa Malay
 ไทย
ไทย Español
 Deutsch
 Български
 Français
 Tiếng Việt
 中文
中文 বাংলা
বাংলা हिन्दी
 Čeština
 Українська
 Română

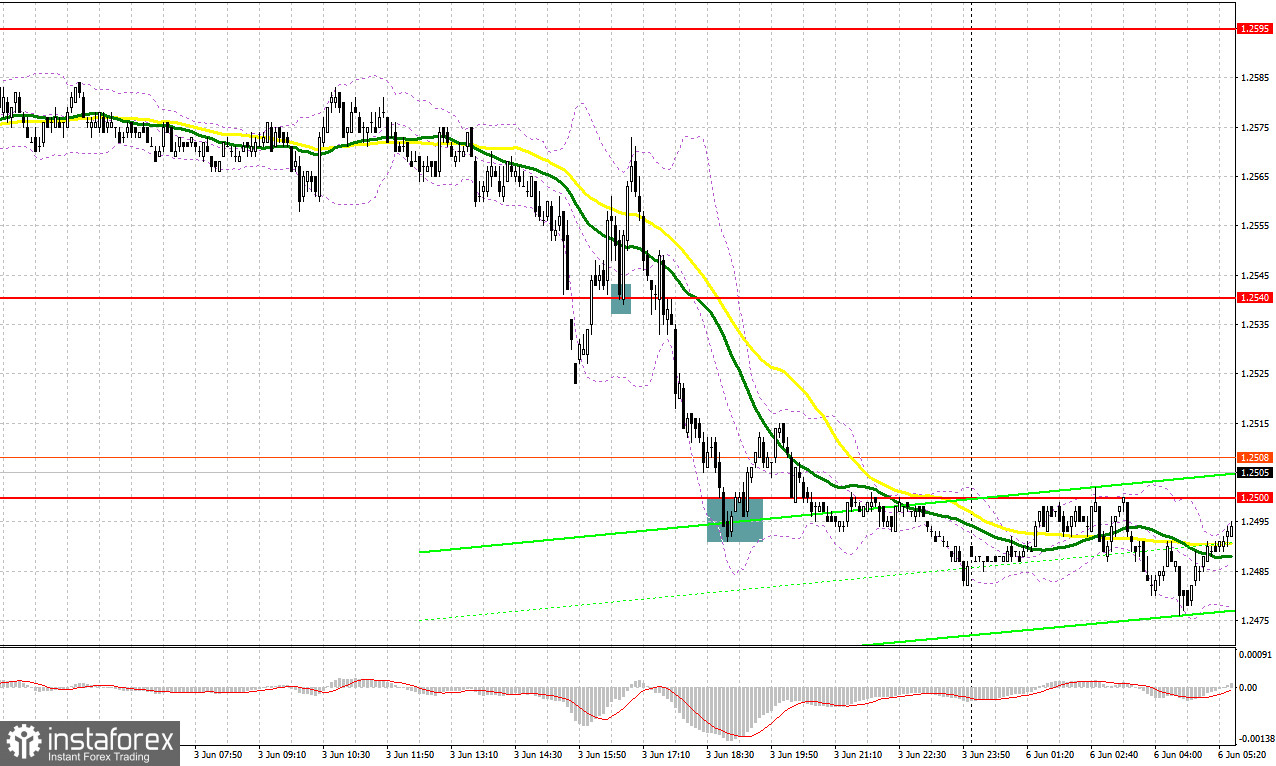
Friday was a rather interesting trading day. Let's now turn to the M5 chart to get a picture of what happened. Several levels were in focus. Yet, the price failed to reach them due to the lack of fundamentals and low volatility. As a result, there were no entry points to the market. After the release of US labor market data, bulls defended 1.2540, and a buy entry point was made after a top-bottom retest of the mark. Pressure on the pair increased after a 20-pip rise. A breakout at 1.2540 triggered a mass sell-off of the pound at 1.2500, where bulls again tried to create a false breakout and a buy entry point. However, after moving up by 15 pips, the pair fell to 1.2500. Consequently, positions were closed at a break-even price.
When to go long on GBP/USD:
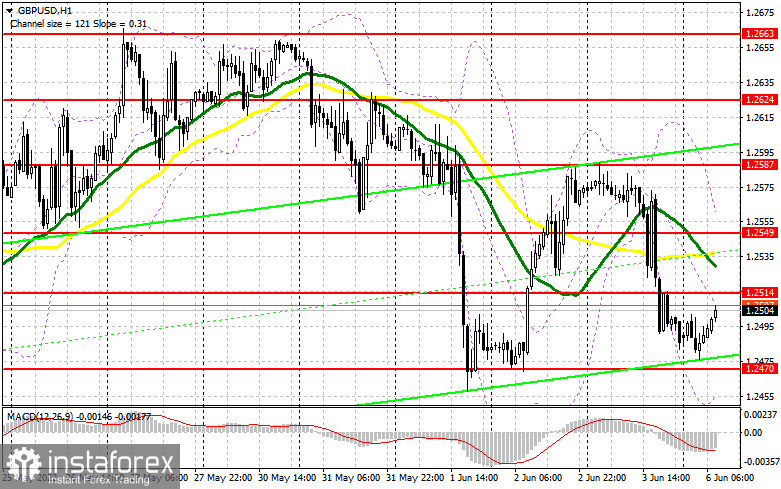
No fundamentals are expected in the United Kingdom today. In the United States, the macroeconomic calendar will also be empty, limiting the downward potential of the pair. Therefore, trades could be opened in the sideways channel on false breakouts. If no rally takes place in the near future, a false breakout at 1.2470 will make the first buy signal. If so, the bullish trend may extend. In an attempt to maintain the bullish market, buyers will also try to fix above the resistance of 1.2514, almost in line with the moving averages that limit the pair's upward potential. The quote may soar after consolidation above this range with a top-bottom retest. In such a case, 1.2549 will stand as the target. Should the pair break through this mark, the upward move would extend to the resistance levels of 1.2587 and 1.2624 where profit-taking should be considered. Meanwhile, if the quote goes down and no bullish activity is seen at 1.2470, pressure on the pair will mount. The bearish trend will stop if the pair reaches 1.2440. Therefore, it would be wise to look for buy entry points after a false breakout of this mark only. Long positions on GBP/USD could also be entered on a bounce off 1.2411 or 1.2371, allowing a 30-35 pips correction intraday.
When to go short on GBP/USD:
Bears will try to protect the nearest resistance level of 1.2514. Its retest is likely to happen soon. A false breakout at 1.2470 will make a sell signal, and a new downtrend will emerge. An additional sell signal will be created after consolidation below 1.2470 and a bottom-top retest of the range, with the target at 1.2440 as well as at 1.2411 where profit-taking could be considered. A more distant target is seen at the 1.2371 low. If the price hits the mark, the uptrend will stop. In the event of bullish GBP/USD and no bearish activity at 1.2514, the pair may rally when a row of bears' stop orders triggers. In such a case, short positions could be opened after a false breakout at 1.2549 only. Short positions on GBP/USD could also be entered on a bounce off 1.2587 or 1.2624, allowing a 30-35 pips downward correction intraday.
Commitments of Traders:
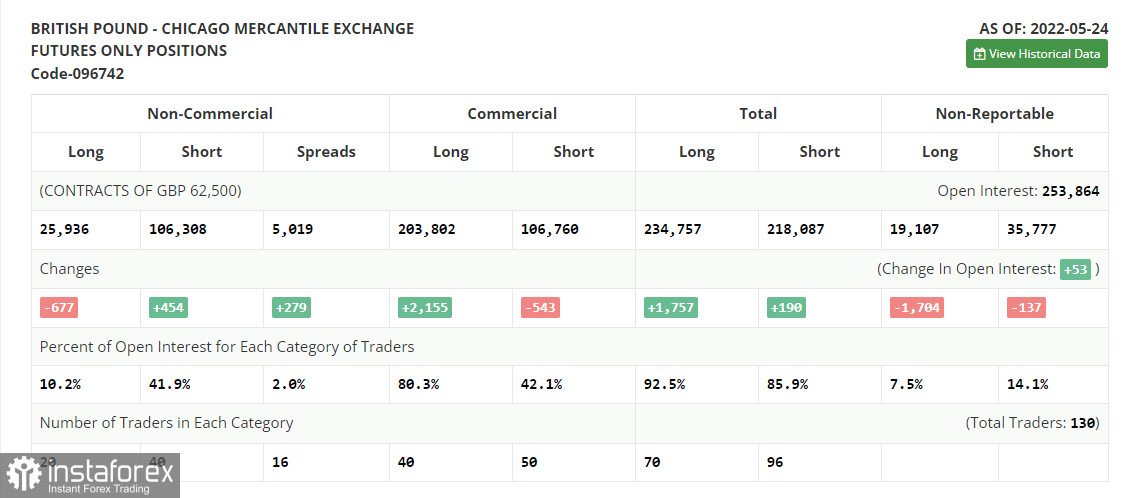
The COT report from May 24 logged a decrease in long positions and an increase in short ones, but market sentiment did not change. Despite growth in the pound, the market remains under bearish control. The lack of fundamental statistics that has been causing the pair's negative reaction lately and modest profit-taking from annual lows allowed GBP/USD to slightly recover. There have been no other objective reasons for growth. The economy continues heading into a recession, inflation is breaking new records, and the cost of living in the UK is steadily rising. The Bank of England is at crossroads. Speculation that the regulator would pause with rate hikes in September is growing. Meanwhile, Governor Andrew Bailey asserts this would not happen. In this light, the US dollar is facing light pressure, and the pound is strengthening. According to the COT report from May 24, long non-commercial positions fell by 667 to 25,936. Short non-commercial positions rose by 454 to 106,308. As a result, the negative value of non-commercial net positions grew to -80,372 from -79,241. The weekly closing price rose from 1.2481 to 1.2511.
Indicator signals:
Moving averages
Trading is carried out below the 30-day and 50-day moving averages, indicating an increase in bullish activity.
Note: The period and prices of moving averages are viewed by the author on the hourly chart and differ from the general definition of classic daily moving averages on the daily chart.
Bollinger Bands
The lower band at 1.2460 stands as support. Resistance is seen at 1.2550 in line with the upper band.
Indicator description:
- Moving average (MA) determines the current trend by smoothing volatility and noise. Period 50. Colored yellow on the chart.
- Moving average (MA) determines the current trend by smoothing volatility and noise. Period 30. Colored green on the chart.
- Moving Average Convergence/Divergence (MACD). Fast EMA 12. Slow EMA 26. SMA 9.
- Bollinger Bands. Period 20
- Non-commercial traders are speculators such as individual traders, hedge funds, and large institutions who use the futures market for speculative purposes and meet certain requirements.
- Long non-commercial positions are the total long position of non-commercial traders.
- Non-commercial short positions are the total short position of non-commercial traders.
- Total non-commercial net position is the difference between short and long positions of non-commercial traders.