 English
  Русский
 Bahasa Indonesia
 Bahasa Malay
 ไทย
ไทย Español
 Deutsch
 Български
 Français
 Tiếng Việt
 中文
中文 বাংলা
বাংলা हिन्दी
 Čeština
 Українська
 Română

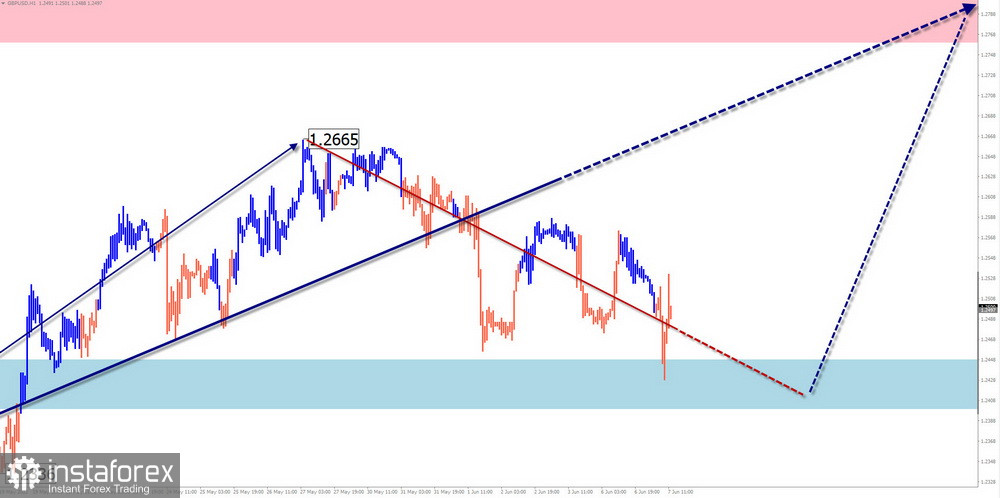
GBP/USD
Analysis:Quotes of the major of the British pound have been moving according to the upward trend algorithm for the past two years. Since the beginning of last year, the price has been forming a downward wave (B). Its structure is currently close to completion. The price has reached the upper limit of a powerful potential reversal zone. Since May 5, an upward correction has been developing within the last section, which has not yet been completed.
Forecast:
Over the coming week, the price of the pound expects a smooth movement from the support border to the area of the resistance zone. By the end of the week, there is a high probability of a reversal and a return of the price to the trend rate.
Potential reversal zones
Resistance:
- 1.2760/1.2810
Support:
- 1.2450/1.2400
Recommendations:
There will be no conditions for the sale of the British pound in the coming days on the pair's market. It is recommended to focus on finding signals for short-term purchases of the instrument. It is worth considering the limited potential of the upcoming recovery. After the appearance of reversal signals in the area of the resistance zone, sales will become relevant again.
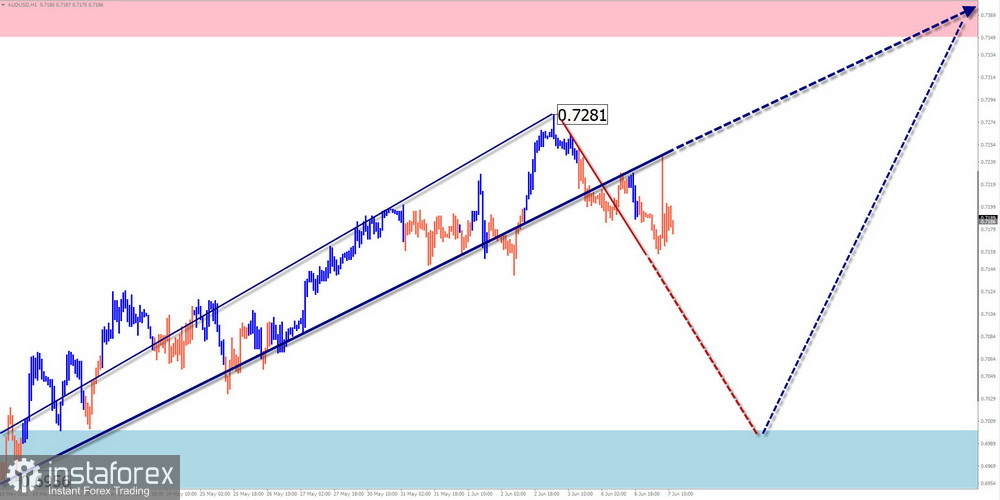
AUD/USD
Analysis:
The main rate of movement of the major Australian dollar since February last year is set by a downward wave. By now, the wave structure looks complete. Since May 12, an upward movement has been rolling back from the upper limit of the powerful support of a large TF. Its wave level has a reversal potential and may be the beginning of a larger wave.
Forecast:
During the current week, the price is expected to move mainly in the lateral plane between the nearest zones in the opposite direction. After contact with the resistance zone, a short-term decrease is likely. By the end of the week, we can expect a resumption of price growth and a second rise to resistance levels. At the same time, there is a great chance of breaking its upper limit.
Potential reversal zones
Resistance:
- 0.7350/0.7400
Support:
- 0.7000/0.6950
Recommendations:
In the coming days, sales on the Australian dollar market may bring profit only in short-term transactions within individual sessions. It is optimal to refrain from entering the pair's market until the end of the upcoming decline, with the purchase of the instrument in the area of the support zone.
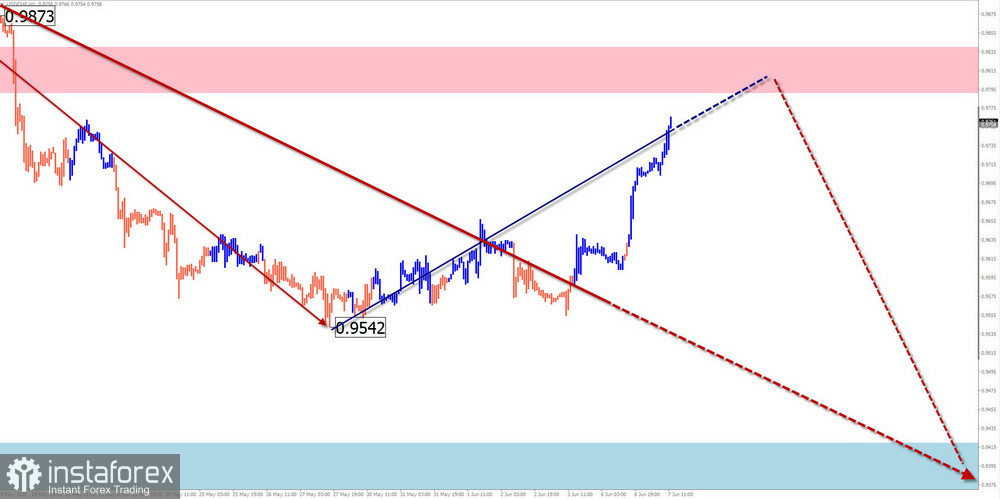
USD/CHF
Analysis:
The trend direction of the main Swiss franc pair since January last year is set by the ascending wave algorithm. From the powerful resistance zone on May 16, the price began to move down, forming a corrective zigzag. In the structure of this movement, a sideways pullback (B) has been observed throughout the last decade.
Forecast:
In the coming days, the Swiss franc quotes should finish their growth within the boundaries of the support zone. Then, with a high probability, a reversal and a resumption of the price decline will follow. The weekly range of the price move down is limited by the calculated support.
Potential reversal zones
Resistance:
- 0.9790/0.9840
Support:
- 0.9420/0.9370
Recommendations:
In the coming week, trading a pair can bring profit only within the framework of individual trading sessions with a fractional lot. Before the appearance of reversal signals in the area of the support zone, purchases are not recommended.
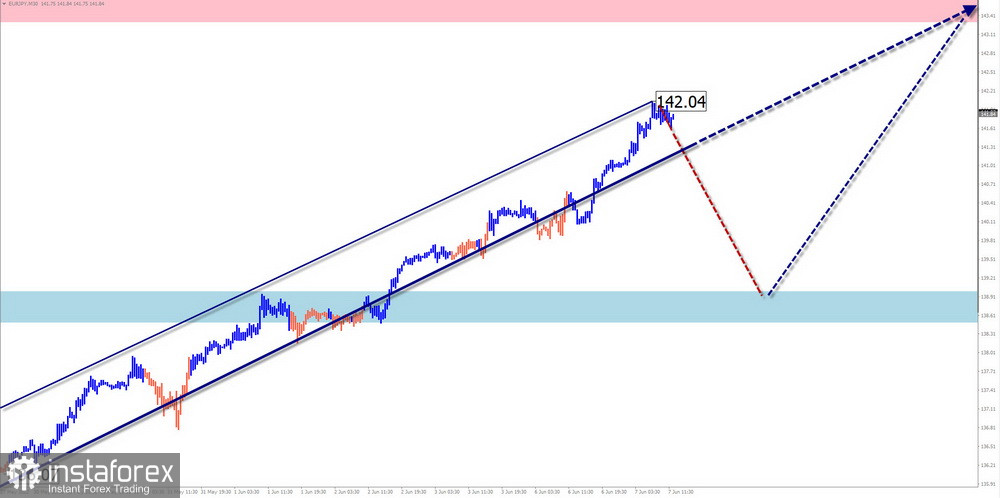
EUR/JPY
Analysis:
The direction of movement of the euro/yen cross pair in the last two years is set by the bullish wave algorithm. At the beginning of March, the final section (C) started. Quotes reached the upper limits of the powerful potential reversal zone of the senior TF. The wave structure does not look complete. There are no reversal signals on the chart.
Forecast:
In the next week, the pair's growth rate is expected to stop and the movement will move mainly to the horizontal plane. A short-term decline in the support zone is not excluded. At the end of the week, we can expect an increase in volatility and a resumption of bullish sentiment.
Potential reversal zones
Resistance:
- 143.30/143.80
Support:
- 139.00/138.50
Recommendations:
Trading in the coming days on the pair's market can be risky. For the time of the upcoming rollback, it is optimal to refrain from trading transactions, with tracking reversal signals for buying at its end.
US Dollar Index
Analysis:
The upward momentum that started in January last year brought the dollar index quotes to the area of strong resistance. Since the middle of last month, the index value has been moving down, forming a corrective zigzag. In the last two weeks, the quotes in the sideways flat form the middle part of the wave (B).
Forecast:
In the coming days, it is worth waiting for the completion of the upward vector of the index movement. In the second half of the week, the probability of a reversal and a resumption of the downward course increases. The support zone shows the most likely level of the weekly movement of the instrument.
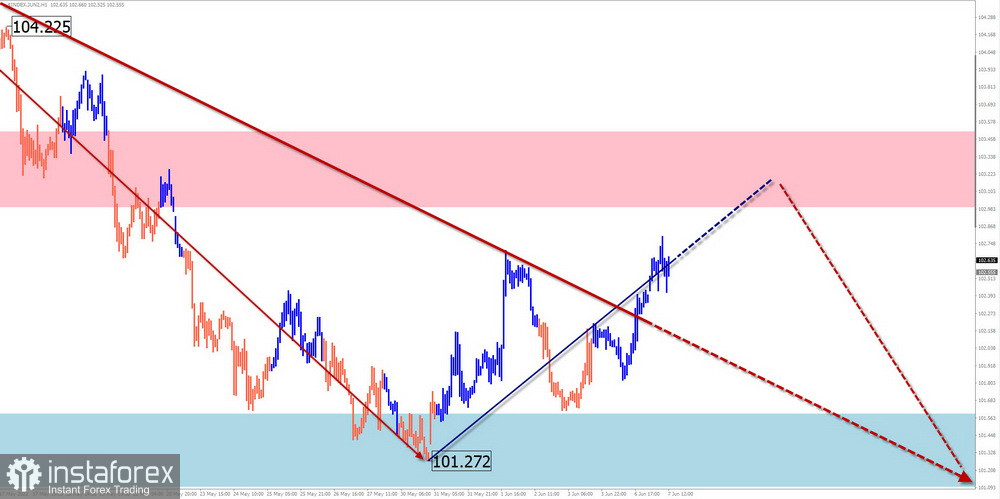
Potential reversal zones
Resistance:
- 103.00/103.50
Support:
- 101.60/101.10
Recommendations:
The period of weakening of national currencies in the main pairs is nearing the end. Deals for sale should be closed in the next couple of days. Supporters of trading for a raise will soon get a good chance to earn.
Explanations: In the simplified wave analysis (UVA), all waves consist of 3 parts (A-B-C). On each TF, only the last, incomplete wave is analyzed. The solid background of the arrows shows the formed structure, and the dotted one shows the expected movements.
Attention: The wave algorithm does not take into account the duration of the movements of the instruments in time!