 English
  Русский
 Bahasa Indonesia
 Bahasa Malay
 ไทย
ไทย Español
 Deutsch
 Български
 Français
 Tiếng Việt
 中文
中文 বাংলা
বাংলা हिन्दी
 Čeština
 Українська
 Română

GBP/USD
Analysis:
The dominant downward wave of the British pound since February last year is nearing completion. By now, its structure looks complete. From the powerful support zone since May 5, quotes have been rolling up, forming a counter wave zigzag. It has a reversal potential and may be the beginning of a new trend wave. In the last two weeks, a correction has been developing within its framework.
Forecast:
The current decline is expected to be completed in the coming week. In the area of settlement support by the end of the week, you can expect the formation of a reversal and a change in the direction of price movement.
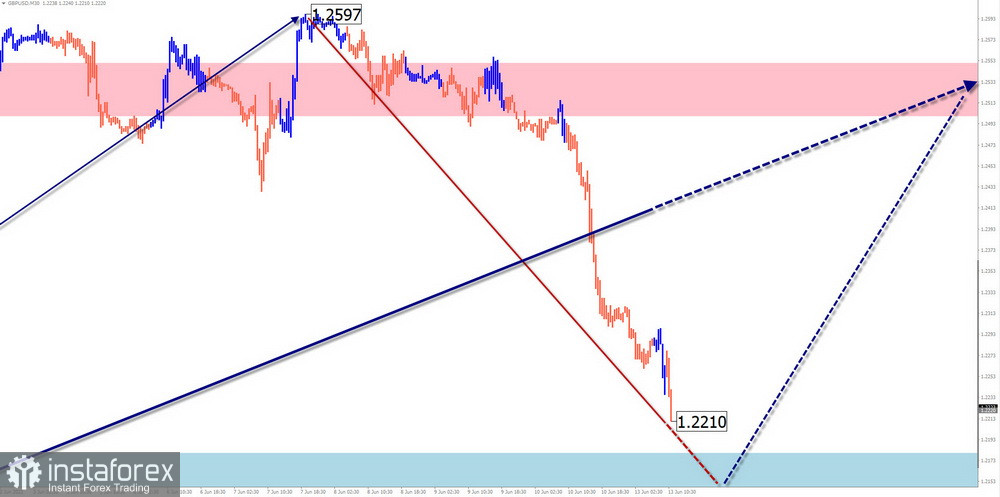
Potential reversal zones
Resistance:
- 1.2500/1.2550
Support:
- 1.2180/1.2130
Recommendations:
Selling the British pound on the major market is risky and can lead to losses of the deposit. It is recommended to refrain from trading transactions until the signals for purchase appear in the area of the support zone.
AUD/USD
Analysis:
The direction of the trend of the Australian dollar in the main pair is set by the downward wave that started in February last year. Its structure is close to completion. All oncoming movements do not go beyond the intermediate correction. The last section of the wave on the main course has been reported since April 5. Within its framework, since June 3, the final section, unfinished for today, has been developing.
Forecast:
In the coming week, the downward movement vector is expected to continue, until its complete completion in the area of calculated support. By the end of the week, the probability of a reversal and the beginning of the growth of the pair's rate increases.
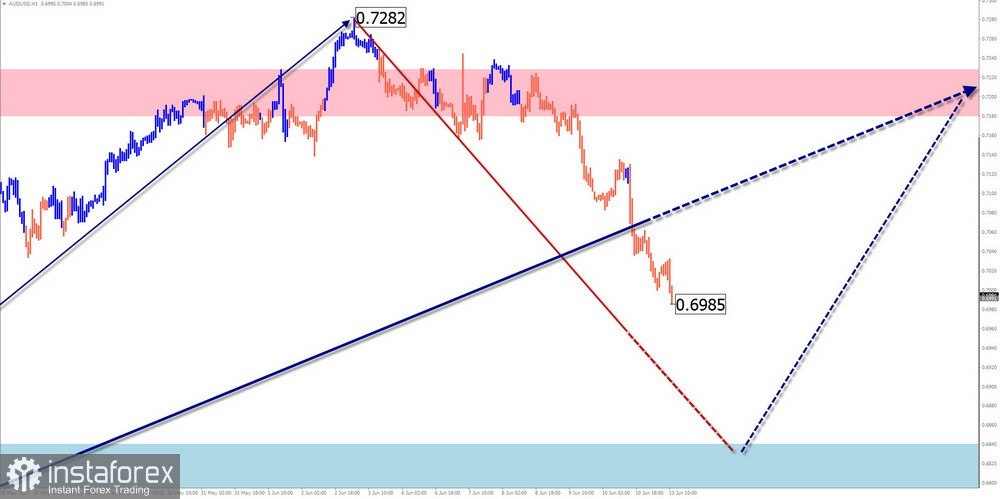
Potential reversal zones
Resistance:
- 0.7180/0.7230
Support:
- 0.6840/0.6790
Recommendations:
Trading on the Australian dollar market in the coming days is possible only within the framework of individual sessions with a fractional lot. There is a high probability of deep counter-rollbacks. It is safer to wait for the completion of the current decline by tracking the reversal signals at its end to buy the instrument.
USD/CHF
Analysis:
Over the past year and a half, the quotes of the Swiss franc in the main pair have been steadily moving into the upper field of the price chart. The unfinished section of the main wave has been counting since May 27. The price is within the powerful potential reversal zone of the weekly chart scale.
Forecast:
In the current weekly period, the price is expected to move to the area of the calculated resistance. In the coming days, a short-term decline is not excluded, up to the support zone. Closer to the weekend, the probability of a reversal and a change in the direction of movement to a downward course increases.
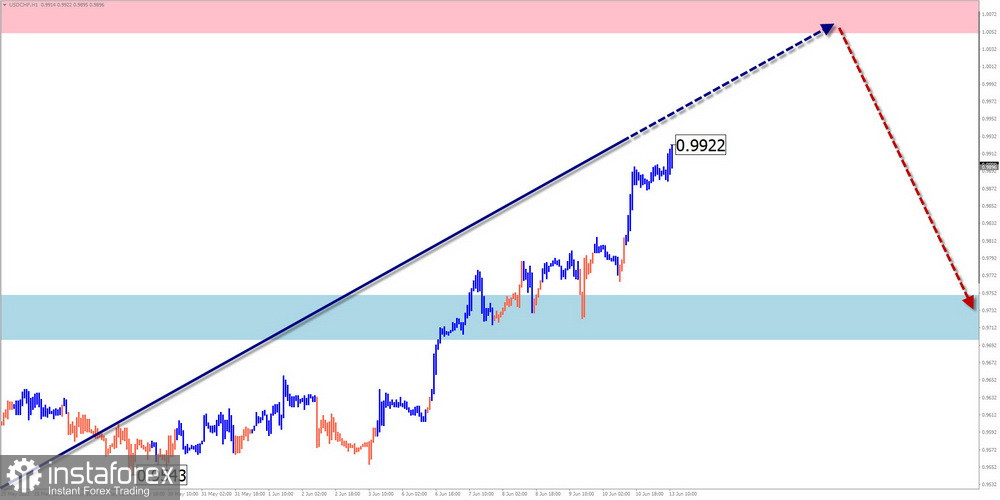
Potential reversal zones
Resistance:
- 1.0050/1.0100
Support:
- 0.9750/0.9700
Recommendations:
In the coming days, purchases will be relevant on the Swiss franc chart. Transactions should take into account the limited potential of the upcoming recovery. Sales will become possible only after the appearance of reversal signals on the vehicle you use.
EUR/JPY
Analysis:
The current wave structure of the European currency/Japanese yen cross has been directed to the "north" of the price chart for the past year and a half. The unfinished section of the main wave started on May 12. Since the end of last week, the price has been forming an intermediate pullback from the lower boundary of the powerful resistance zone.
Forecast:
The pair's downward course is expected in the next few days. Further, in the area of settlement support, the formation of a reversal and the resumption of a price rise is likely. When changing the course, a short-term puncture of the lower border of the support zone is not excluded.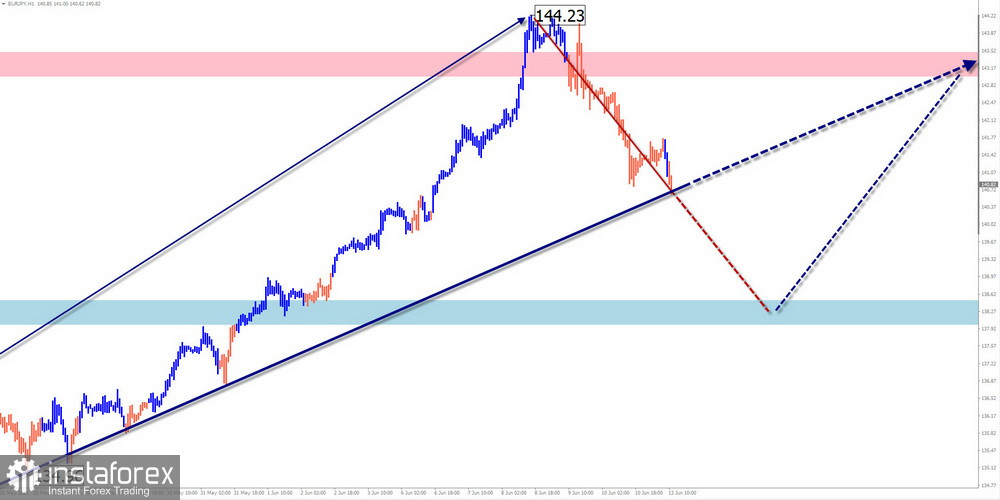
Potential reversal zones
Resistance:
- 143.50/144.00
Support:
- 138.50/138.00
Recommendations:
Trading on the pair's market in the coming days may be profitable within the framework of individual sessions with a reduced lot. Purchases will become possible after the appearance of confirmed reversal signals in the settlement support area.
US Dollar Index
Analysis:
Since January last year, the quotes of the US dollar have been steadily strengthening against national currencies. The rising wave of the dollar index has brought quotes to the area of a powerful potential reversal zone of the monthly scale of the chart. The analysis of the structure indicates the imminent completion of the ascent. There are no reversal signals on the chart yet.
Forecast:
During the week, the end of the upward movement rate is expected, the formation of a reversal and the beginning of a weakening of the dollar. With a reversal, there is a high probability of an increase in volatility. The reason for the change, of course, may be the release of important blocks of economic news.
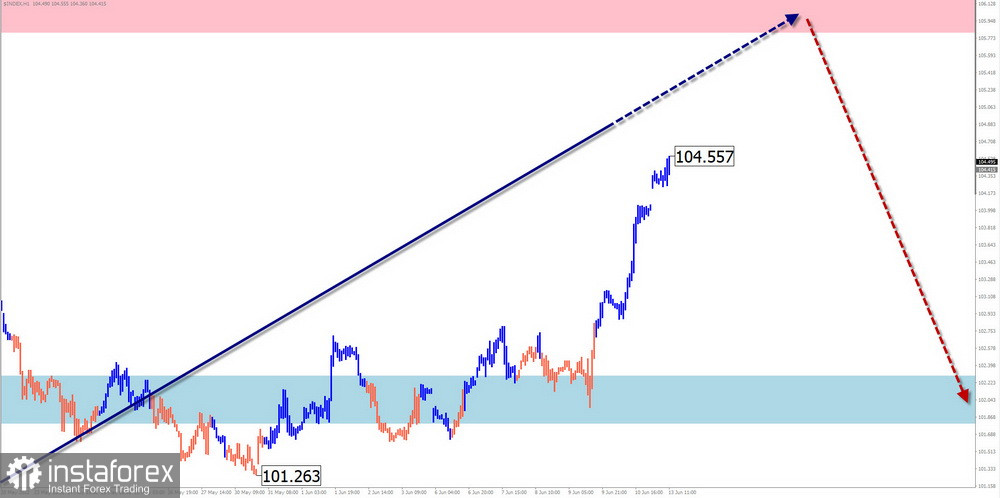
Potential reversal zones
Resistance:
- 105.80/106.30
Support:
- 102.30/101.80
Recommendations:
When forming a trading strategy in the coming week, it is worth taking into account the limited strengthening of the dollar's positions. Purchases of national currencies will become relevant after the appearance of confirmed signals of a reversal of the US dollar.
#Ethereum
Analysis:
Since November last year, Ethereum quotes have been at the mercy of a downward trend. The price pushed down a powerful support level, which became a powerful resistance. The analysis of the structure shows that the final section is formed as waves. There are no reversal signals on the chart.
Forecast:
In the coming week, a gradual decline in the level of quotes is expected from the resistance zone to the area of settlement support. A sideways flat along the resistance levels is possible in the next couple of days. The greatest activity is likely by the end of the week.
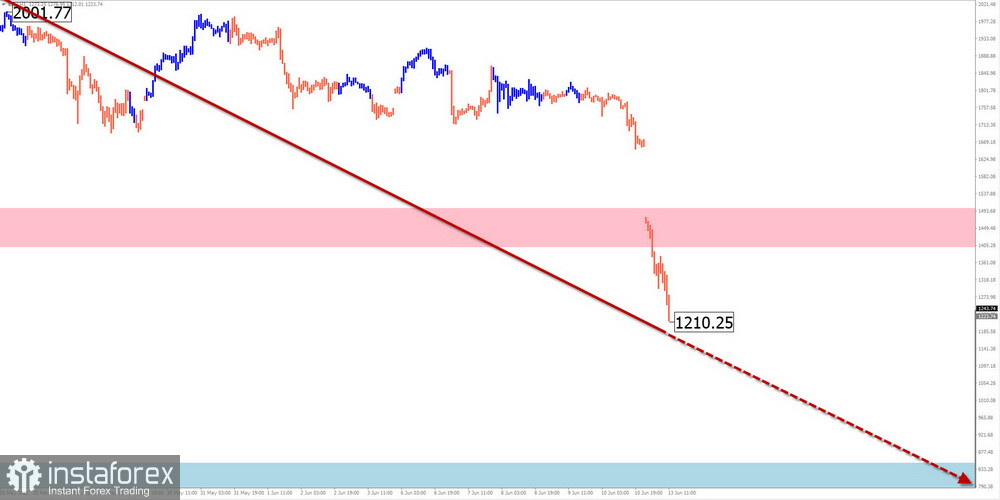
Potential reversal zones
Resistance:
- 1400.00/1500.00
Support:
- 850.00/750.00
Recommendations:
There are no conditions for buying ether on the market of this crypt. At the end of all upcoming pullbacks up, supporters of the decline can open deals for sale.
Explanations: In the simplified wave analysis (UVA), all waves consist of 3 parts (A-B-C). On each TF, only the last, incomplete wave is analyzed. The solid background of the arrows shows the formed structure, and the dotted one shows the expected movements.
Attention: The wave algorithm does not take into account the duration of the movements of the instruments in time!