 English
  Русский
 Bahasa Indonesia
 Bahasa Malay
 ไทย
ไทย Español
 Deutsch
 Български
 Français
 Tiếng Việt
 中文
中文 বাংলা
বাংলা हिन्दी
 Čeština
 Українська
 Română

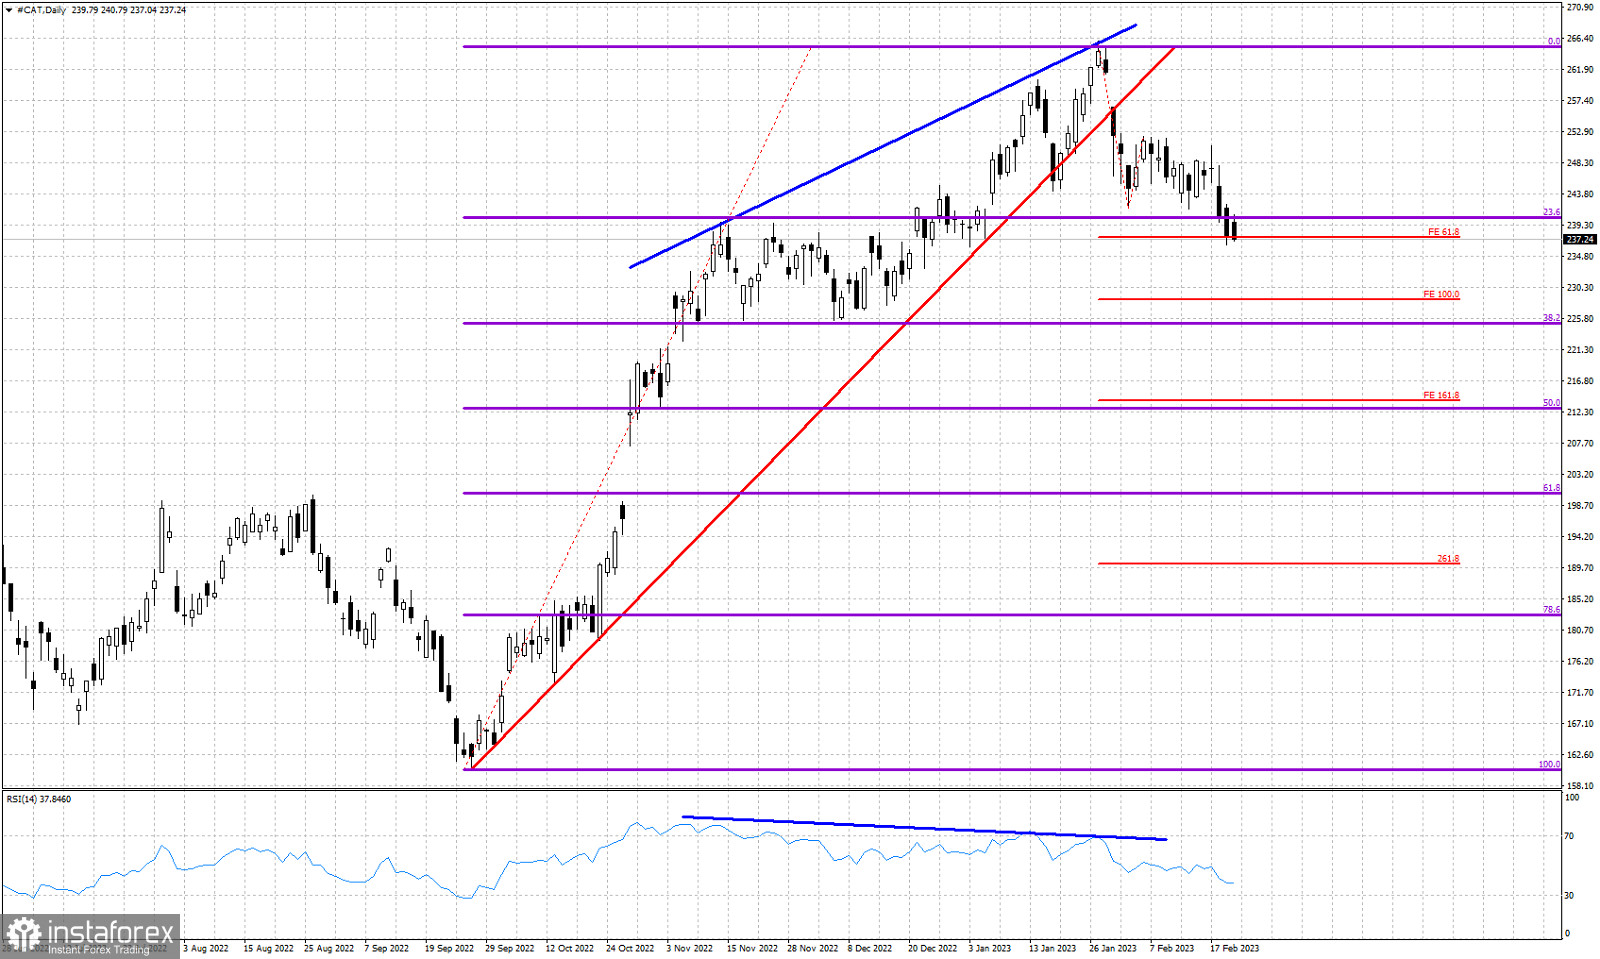
Blue lines- bearish RSI divergence
Red line- support trend line
Violet lines- Fibonacci retracement levels
Red horizontal lines- Fibonacci extension targets
Back in early February we warned traders regarding the vulnerability of the CAT stock and the bearish signal we got when price broke key short-term support. Back then we noted that a pull back towards $244 was expected and maybe lower towards $230. Price has now reached the first target and is showing potential for a move even lower. The RSI is far from oversold conditions. Price is making lower lows and lower highs. Short-term trend is bearish and we are in a pull back phase relative to the upward move that started back in September. Major support and major target remains the 38% Fibonacci level at $225.