 English
  Русский
 Bahasa Indonesia
 Bahasa Malay
 ไทย
ไทย Español
 Deutsch
 Български
 Français
 Tiếng Việt
 中文
中文 বাংলা
বাংলা हिन्दी
 Čeština
 Українська
 Română

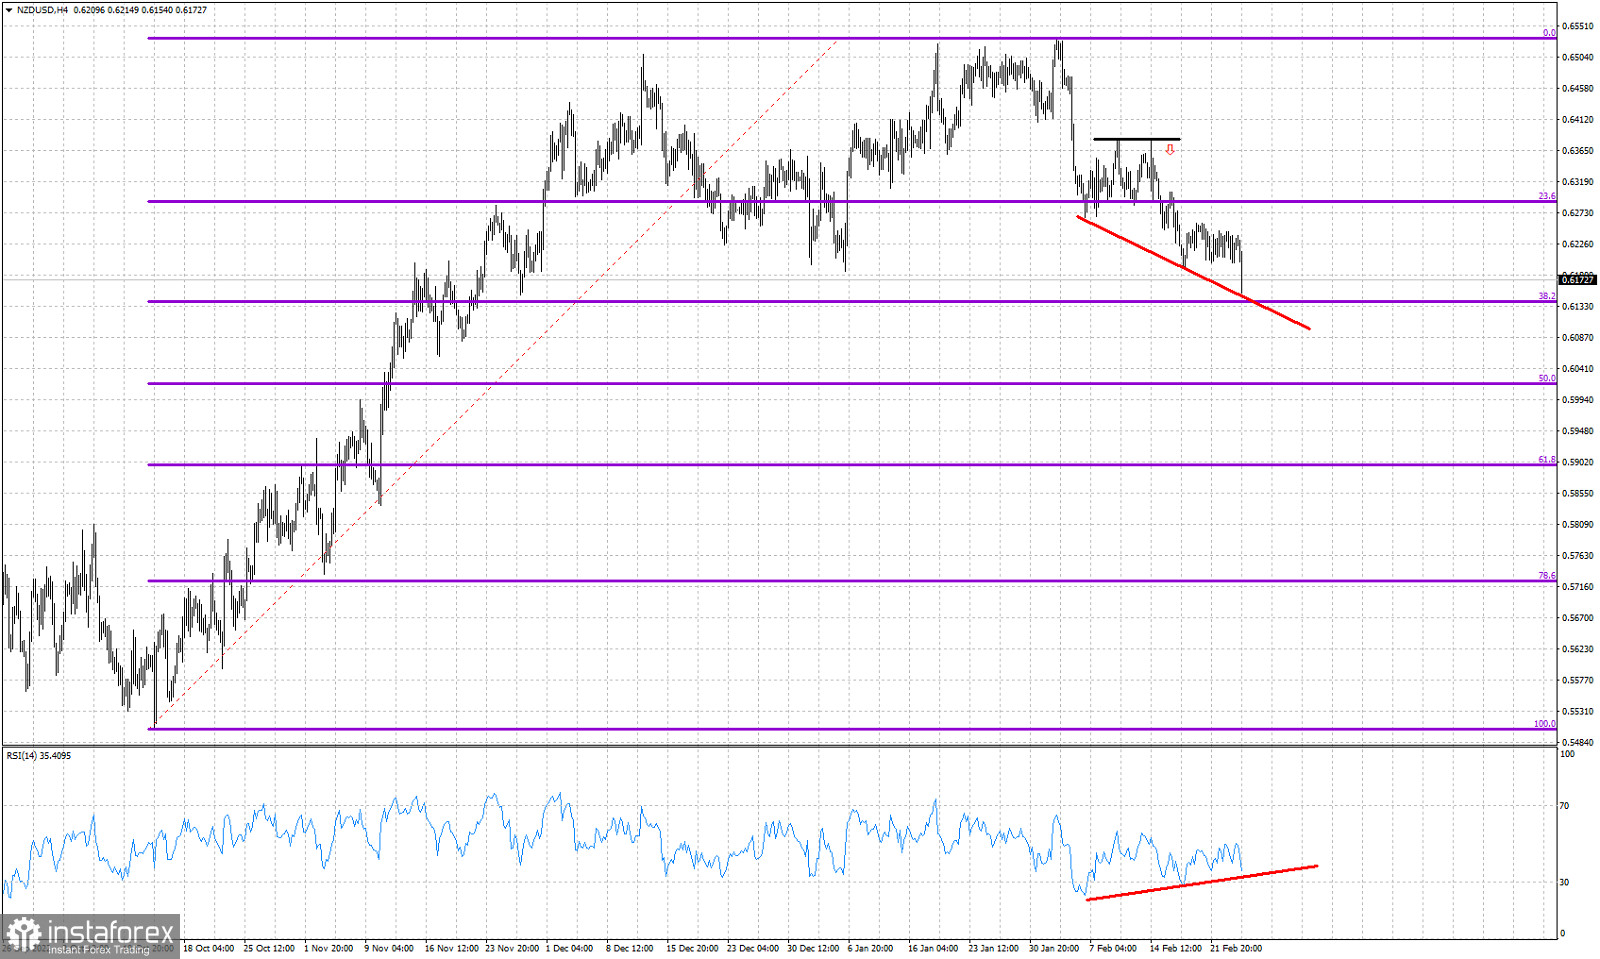
Violet lines- Fibonacci retracements
Red lines- Bullish RSI divergence
In our last analysis on NZDUSD when price was trading around 0.6270 we warned that price was vulnerable to more downside. Our target was the 38% Fibonacci retracement. Short-term support at 0.6250 and 0.62 was broken and price made new lower lows. Our minimum pull back target has been reached. The RSI is making higher lows as price is making lower lows. This is the second bullish divergence we see. We must repeat that this is not a reversal signal but only a warning. With price so close to key Fibonacci support and bullish RSI divergence, bears should be very cautious for a possible bounce higher.