 English
  Русский
 Bahasa Indonesia
 Bahasa Malay
 ไทย
ไทย Español
 Deutsch
 Български
 Français
 Tiếng Việt
 中文
中文 বাংলা
বাংলা हिन्दी
 Čeština
 Українська
 Română

On Friday, traders received only one signal to enter the market. Let us take a look at the 5-minute chart to figure out what happened. Earlier, I asked you to focus on the level of 1.0549 to decide when to enter the market. In the first part of the day, mixed data from Germany capped the euro's rise. A failure to increase above 1.0549 and a false break led to a sell signal. As a result, the pair dropped by more than 35 pips, but did not hit the nearest support level of 1.0497. In the second part of the day, there were no signals to enter the market. The fact is that after a breakout of 1.0549, a test of this level did allow buyers to settle above it.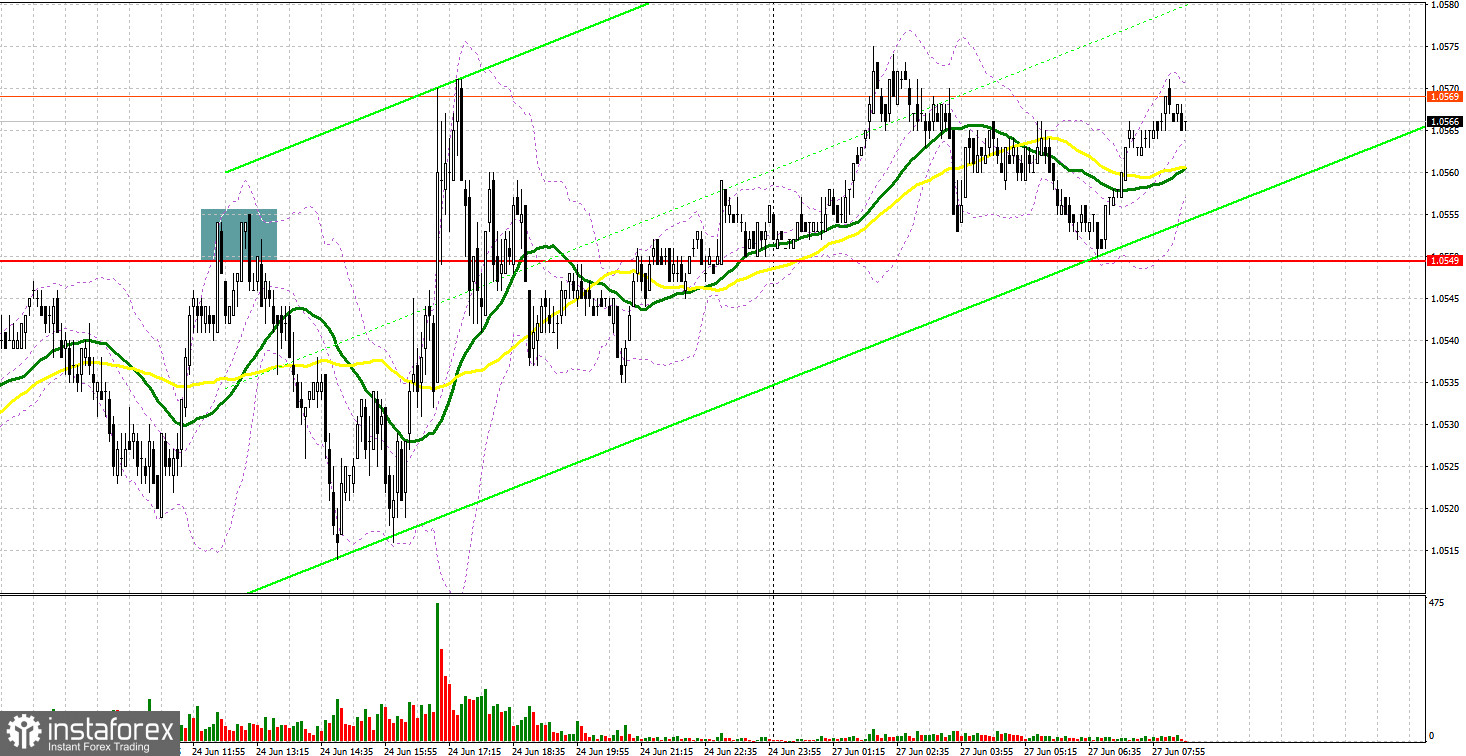
Conditions for opening long positions on EUR/USD:
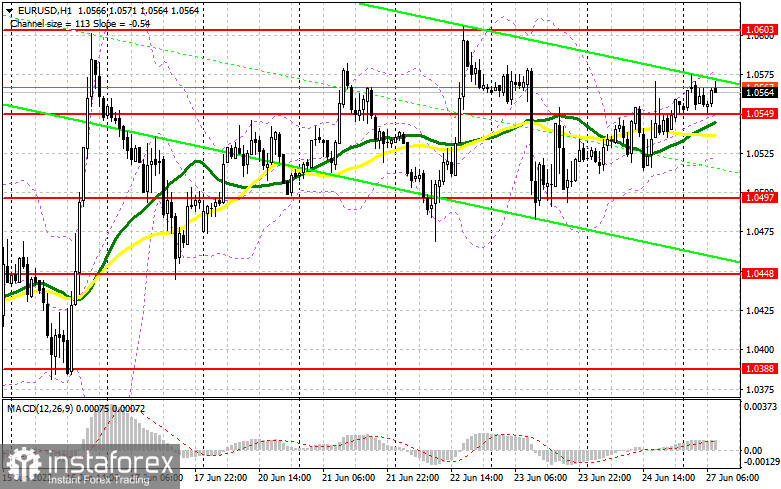
Data from the US was also mixed and limited the greenback's upward potential against the euro. As a result, the US dollar did not leave the sideways channel. Today, during the Asian trade bulls managed to gain control over 1.0549. Now, the euro may continue rising in the short term. As for macroeconomic reports, today, Germany is going to disclose its retail sales data for May. Economists expect a decline. Meanwhile, France will report the number of unemployed people, but the data will hardly affect the market. What is more, comments that will be provided by Christine Lagarde in the second part of the day are unlikely to support buyers of the euro since she may repeat the already known information. If the pair drops amid weak data from Germany, bulls should primarily protect the nearest level of 1.0549, which is acting as a middle limit of the sideways channel. Slightly below this level, there are moving averages. That is why a false breakout of the mentioned level will give a long signal with the target at 1.0603, the upper limit of the range. A break and downward test of 1.0603 may affect bears' stop orders, thus allowing the pair to leave the sideways channel and reach 1.0640, forming a new uptrend towards 1.0663 and 1.0687. The next target is located at 1.0714, where it is recommended to lock in profits. If the euro/dollar pair falls and buyers fail to protect 1.0549, the price may return to its previous levels. In this case, it will be better to go long after a false breakout near the support level of 1.0497. It is also possible to buy the asset from 1.0438 or lower – from 1.0388, expecting a rise of 30-35 pips.
Conditions for opening short positions on EUR/USD:
Bears still have a chance to revive the downtrend. However, the likelihood of a downtrend is just 50% and the situation will hardly change today. If the euro increases in the first part of the day amid strong data from Germany and France, only a false break of 1.0603 will give a sell signal with the target in the middle of the sideways channel of 1.0549. A breakout and settlement below this level as well as an upward test of this level may form an additional sell signal that may affect buyers' stop orders and push the price to 1.0497. Buyers and sellers will fight for this level since a decline below it could be fatal for buyers. The next target is located near 1.0388. If the euro/dollar pair increases during the European session and bears fail to protect 1.0603, it will be better to avoid sell orders until the price hits 1.0640. A false breakout of this level may launch a downward correction. It is also possible to sell the asset from 1.0663 or higher – from 1.0687, expecting a drop of 30-35 pips.
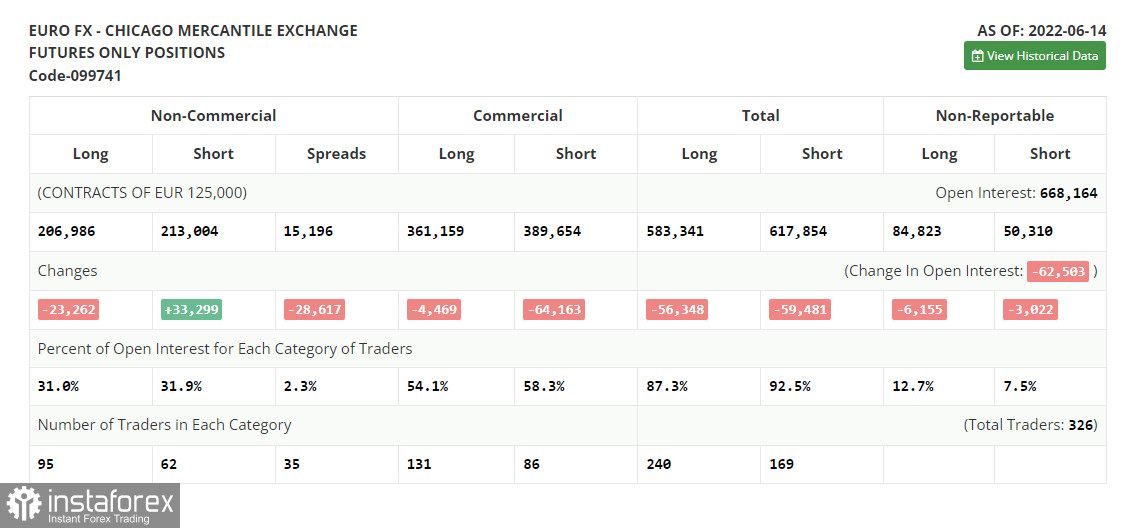
COT report
According to the COT report from June 14, the number of long positions tumbled, whereas the number of short positions increased, thus pointing to the formation of bearish sentiment. Since the ECB meeting took place long ago, traders were focused on the Fed's interest rate decision. Thus, the US regulator raised the benchmark rate by 0.75% at once, announcing its intention to continue combating the surging inflation. Since politicians stick to tight monetary policy, traders have to sell off risk assets and switch to the US dollar, thus boosting its price. The situation will hardly change, as monetary authorities will continue curbing inflation by means of higher interest rates. The COT report unveiled that the number of long non-commercial positions declined by 23,262 to 206,986, whereas the number of short non-commercial positions jumped by 33,299 to 213,004. Although the price of the euro is very low, it does not add to the attractiveness of the asset. Traders still prefer the greenback. Results of the week showed that the total non-commercial net position turned negative and decreased from 50,543 to -6,018. The weekly closing price dropped to 1.0481 against 1.0710.
Signals of indicators:
Moving Averages
Trading is performed around 30- and 50-day moving averages, which points to the market uncertainty.
Note: The period and prices of moving averages are considered by the author on the one-hour chart that differs from the general definition of the classic daily moving averages on the daily chart.
Bollinger Bands
If the euro/dollar pair drops, the support level will be located at the lower limit of the indicator at 1.0525. In case of a rise, the upper limit of the indicator at 1.0580 will act as resistance.
Description of indicators- Moving average (moving average, determines the current trend by smoothing volatility and noise). The period is 50. It is marked in yellow on the chart.
- Moving average (moving average, determines the current trend by smoothing volatility and noise). The period is 30. It is marked in green on the graph.
- MACD indicator (Moving Average Convergence/Divergence - convergence/divergence of moving averages). A fast EMA period is 12. A slow EMA period is 26. The SMA period is 9.
- Bollinger Bands. The period is 20.
- Non-profit speculative traders are individual traders, hedge funds, and large institutions that use the futures market for speculative purposes and meet certain requirements.
- Long non-commercial positions is a total number of long positions opened by non-commercial traders.
- Short non-commercial positions is a total number of short positions opened by non-commercial traders.
- The total non-commercial net position is a difference in the number of short and long positions opened by non-commercial traders.