 English
  Русский
 Bahasa Indonesia
 Bahasa Malay
 ไทย
ไทย Español
 Deutsch
 Български
 Français
 Tiếng Việt
 中文
中文 বাংলা
বাংলা हिन्दी
 Čeština
 Українська
 Română

Details of the economic calendar from June 24
UK retail sales data showed a slowdown in the decline from -5.7% to -4.7%. This is a positive factor, if not for the revision of the previous indicators for the worse from -4.9% to 5.7%, as well as the forecast of a stronger slowdown to -4.1%.
The bottom line shows bad statistics, which negatively affects the British currency.
Analysis of trading charts from June 24
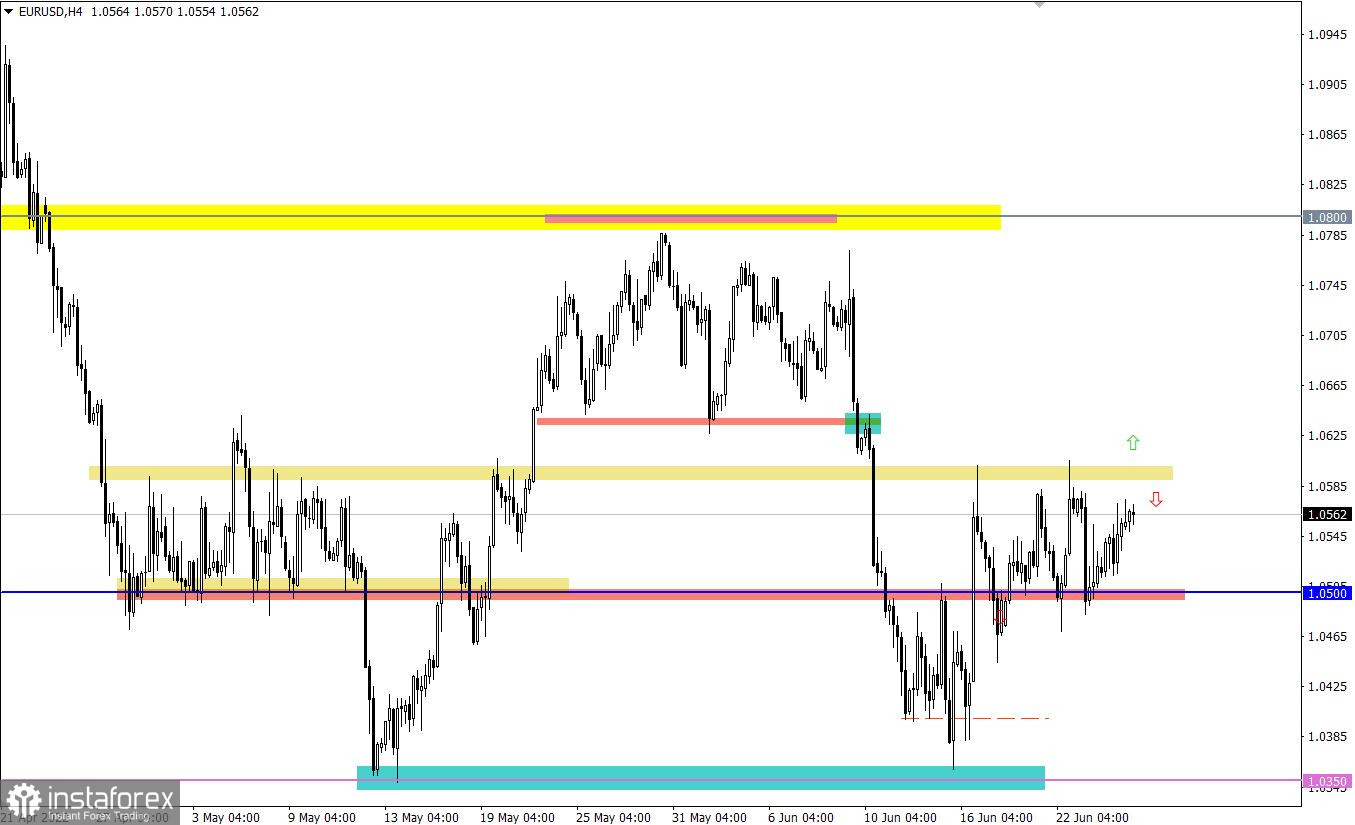
The EURUSD currency pair is moving within the range of 1.0500/1.0600, having local breaks, from time to time, that did not lead to violation of the set amplitude.
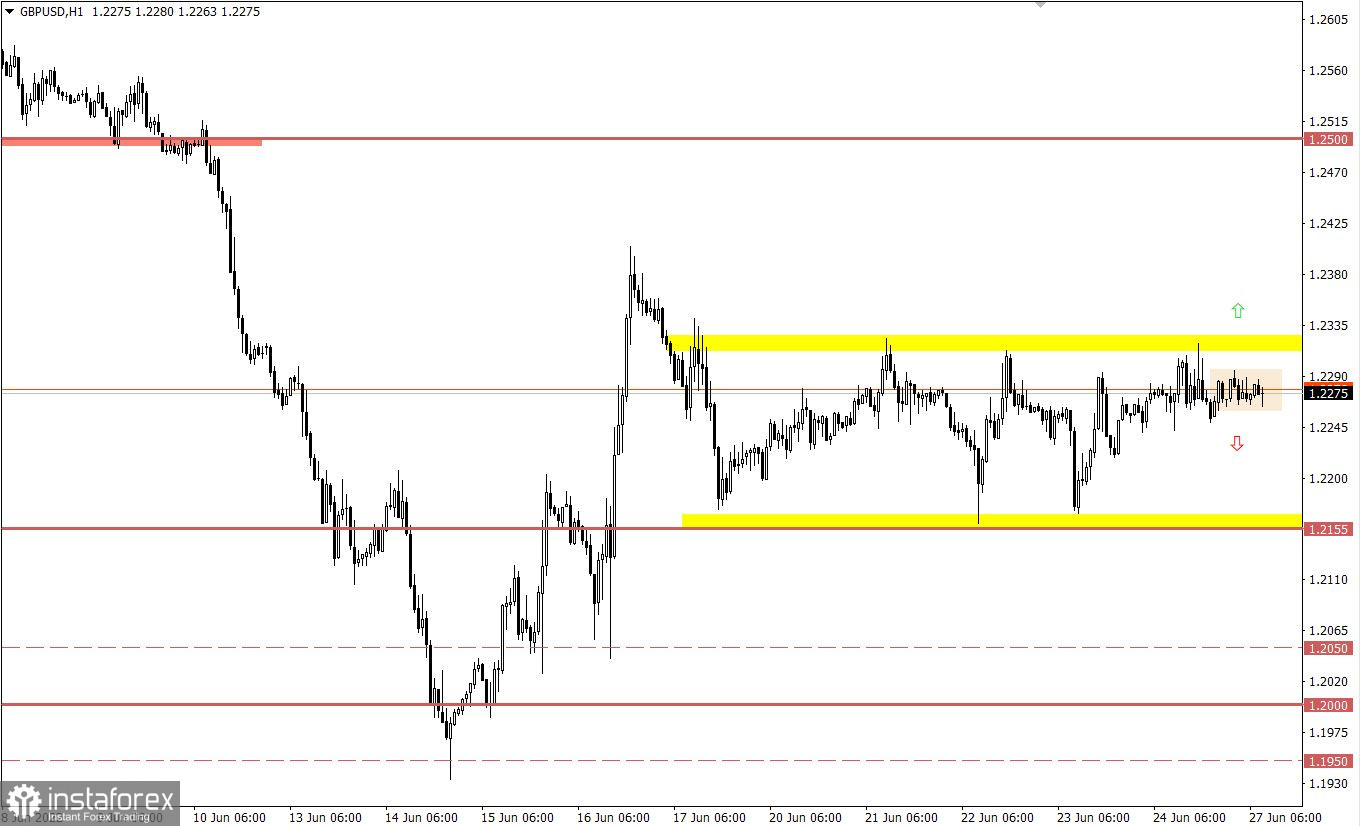
The GBPUSD currency pair has formed a stagnation within the stagnation. For the second week, the quote has been moving within the flat 1.2150/1.2320, where a stagnation was formed within its upper border. Price fluctuations in a closed corridor indicate a characteristic uncertainty among market participants, which can lead to the accumulation of trading forces.

Economic calendar for June 27
Today, during the American trading session, data on orders for durable goods in the United States will be published, where May figures may decrease by 0.3%. If the data is confirmed, this is a negative factor, which can negatively affect the US dollar.
Trading plan for EUR/USD on June 27
The flat is still relevant in the market, for this reason, traders are considering a scenario of a price rebound from the upper limit. If expectations coincide, the quote may slow down the growth rate, showing downward interest.
At the same time, market participants are considering a flat breakout scenario. An increase in the volume of long positions may occur when the price holds above the value of 1.0600 in a four-hour period.
Trading plan for GBP/USD on June 27
In this situation, a short-term stagnation within the upper limit can become a lever in the subsequent acceleration in the market. Buy positions are taken into account after holding the price above the value of 1.2325 in a four-hour period. This step will indicate the completion of the flat. Sell positions should be considered after holding the price below 1.2250 in a four–hour period with the prospect of a move to 1.2200-1.2150.
What is reflected in the trading charts?
A candlestick chart view is graphical rectangles of white and black light, with sticks on top and bottom. When analyzing each candle in detail, you will see its characteristics of a relative period: the opening price, closing price, and maximum and minimum prices.
Horizontal levels are price coordinates, relative to which a stop or a price reversal may occur. These levels are called support and resistance in the market.
Circles and rectangles are highlighted examples where the price of the story unfolded. This color selection indicates horizontal lines that may put pressure on the quote in the future.
The up/down arrows are the reference points of the possible price direction in the future.