 English
  Русский
 Bahasa Indonesia
 Bahasa Malay
 ไทย
ไทย Español
 Deutsch
 Български
 Français
 Tiếng Việt
 中文
中文 বাংলা
বাংলা हिन्दी
 Čeština
 Українська
 Română

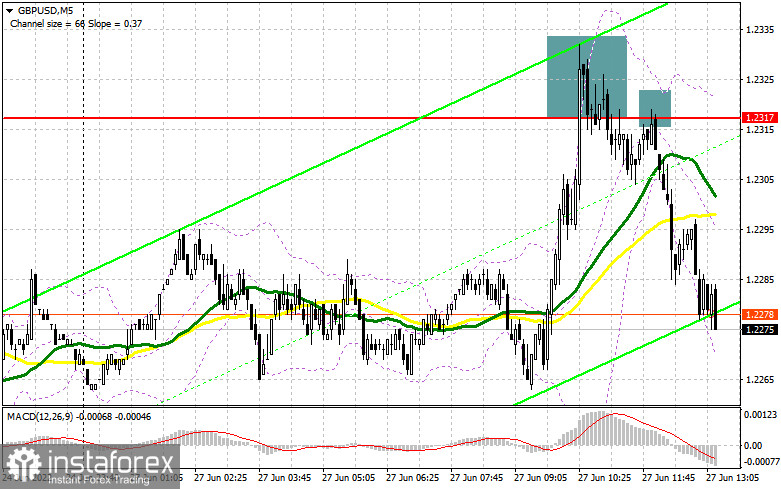
In my morning forecast, I paid attention to the 1.2317 level and recommended making decisions from it. Let's look at the 5-minute chart and figure out what happened there. Growth and another unsuccessful attempt to get above 1.2317 by analogy with Friday's attempt to break out of the side channel – all this led to a sell signal for the pound. At the time of writing, the pair has gone down more than 40 points and the pressure on the trading instrument remains. From a technical point of view, nothing has changed, nor has the strategy itself changed. And what were the entry points for the euro?
To open long positions on GBP/USD, you need:
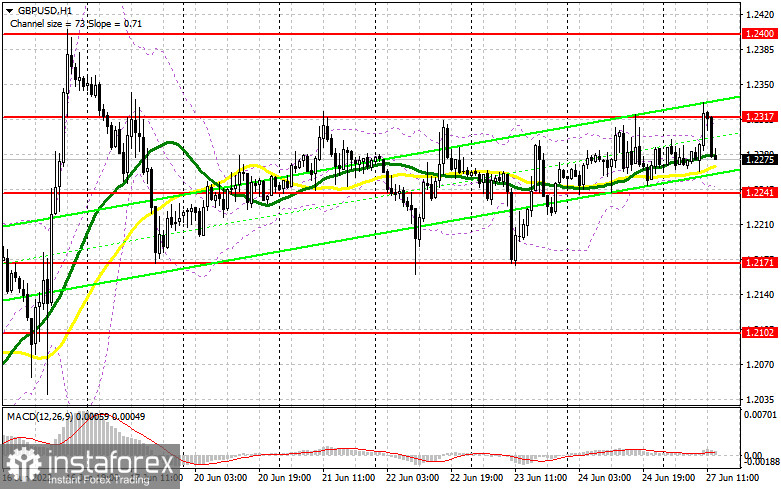
The lack of statistics on the pound allowed buyers to make another attempt to break 1.2317, but it was not possible to gain a foothold above this level. During the American session, data on the volume of sales of long-term goods were released today, which may increase pressure on the pound - if the indicators turn out to be much better than economists' forecasts. If the reports coincide with the forecasts, most likely the pair will continue trading in the side channel with the prospect of re-updating the resistance at 1.2317. In case of a return of pressure on the pound after the data, the bulls will try to protect 1.2241. Only the formation of a false breakdown there will give a signal to open new long positions in the expectation of growth to the nearest level of 1.2317. In the morning forecast, I said that this level is critically important for bulls since by returning it under control, it will be possible to count on the resumption of the bull market formed on June 14. A breakout and a top-down test of 1.2317 will give a buy signal based on the 1.2400 update. A similar breakthrough at this level will lead to another entry point into long positions with the prospect of reaching 1.2452, where I recommend fixing the profits. A more distant target will be the 1.2484 area. If GBP/USD falls and there are no buyers at 1.2241 in the afternoon, the pressure on the pair will increase. In this scenario, I advise you to open new long positions only on a false breakout from the lower border of the side channel 1.2171. You can buy GBP/USD immediately for a rebound from 1.2102, or even lower – around 1.2030 with the aim of correction of 30-35 points within a day.
To open short positions on GBP/USD, you need:
The bears did everything possible to return to the market and defended 1.2317. Most likely, the emphasis will now be placed on 1.2241 and on fixing below this range. In the case of weak data on the index of pending sales in the real estate market and the volume of orders for durable goods in the United States, it will be possible to observe another upward jerk of the pound. Therefore, only the formation of a false breakdown at 1.2317 will lead to the formation of another sell signal with the prospect of a return to 1.2241. Its breakthrough will lead to a sell-off and a return of GBP/USD to the area of the lower border of the side channel. However, only a consolidation below 1.2241 and a reverse test from the bottom up will give an entry point into short positions. A more distant target will be the 1.2102 area, the test of which will testify to the defeat of buyers. With the option of GBP/USD growth and the absence of bears at 1.2317, we will only have to count on the nearest resistance of 1.2400. A false breakout at this level will give a good entry point into short positions in the expectation of at least some downward correction. If there is no activity at 1.2400, another upward jerk may occur against the background of the demolition of stop orders of speculative sellers. In this case, I advise you to postpone short positions to 1.2452. But even there, I advise selling the pound only in case of a false breakdown, since going beyond this range will increase demand for GBP/USD. Short positions can be viewed immediately for a rebound from 1.2484, or even higher – from 1.2516, counting on the pair's rebound down by 30-35 points inside the day.
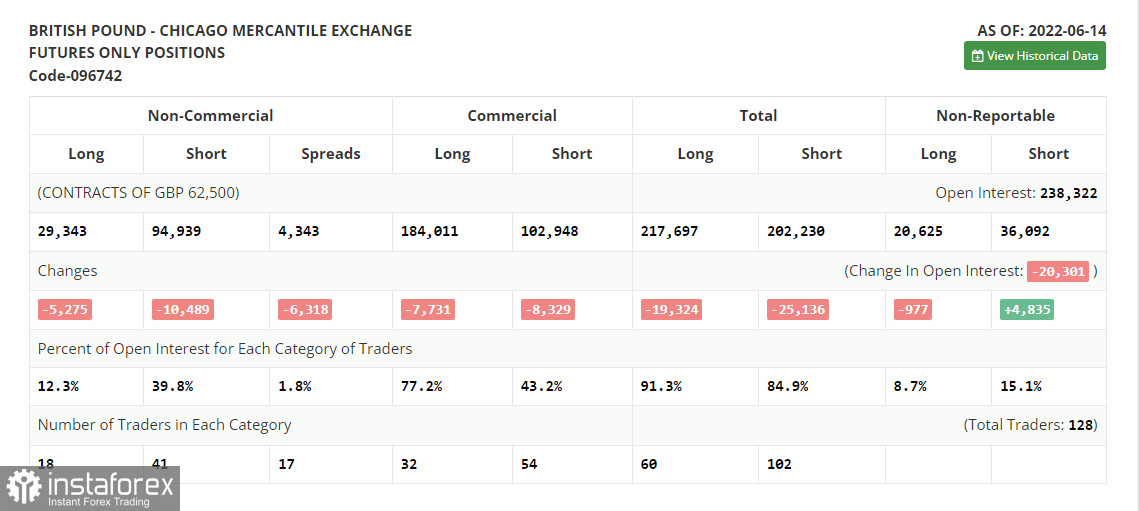
The COT report (Commitment of Traders) for June 14 recorded a reduction in both long and short positions, which led to a slight decrease in the negative delta. After the meeting of the Bank of England, at which it was announced that it would adhere to the previous plan to raise interest rates and combat high inflation, the pound strengthened its position, which will affect future COT reports. For sure, the big players are taking advantage of the moment and buying back the much cheaper pound, despite all the negative that is happening with the UK economy now. However, one should not rely too much on the pair's recovery in the near future, since the policy of the Federal Reserve System will seriously help the US dollar in the fight against risky assets. The COT report indicates that long non-commercial positions decreased by 5,275 to the level of 29,343, while short non-commercial positions decreased by 10,489 to the level of 94,939. This led to a decrease in the negative value of the non-commercial net position from the level of -70,810 to the level of -65,596. The weekly closing price decreased to 1.1991 against 1.2587.
Signals of indicators:
Moving averages
Trading is conducted around 30 and 50 daily moving averages, which indicates market uncertainty.
Note: The period and prices of moving averages are considered by the author on the hourly chart H1 and differ from the general definition of the classic daily moving averages on the daily chart D1.
Bollinger Bands
In the case of growth, the average border of the indicator around 1.2310 will act as resistance. In the case of a decline, the lower limit of the indicator in the 1.2240 area will act as support.
Description of indicators
- Moving average (moving average determines the current trend by smoothing out volatility and noise). Period 50. The graph is marked in yellow.
- Moving average (moving average determines the current trend by smoothing out volatility and noise). Period 30. The graph is marked in green.
- MACD indicator (Moving Average Convergence / Divergence - moving average convergence/divergence) Fast EMA period 12. Slow EMA period 26. SMA period 9
- Bollinger Bands (Bollinger Bands). Period 20
- Non-profit speculative traders, such as individual traders, hedge funds, and large institutions use the futures market for speculative purposes and to meet certain requirements.
- Long non-commercial positions represent the total long open position of non-commercial traders.
- Short non-commercial positions represent the total short open position of non-commercial traders.
- Total non-commercial net position is the difference between the short and long positions of non-commercial traders.