 English
  Русский
 Bahasa Indonesia
 Bahasa Malay
 ไทย
ไทย Español
 Deutsch
 Български
 Français
 Tiếng Việt
 中文
中文 বাংলা
বাংলা हिन्दी
 Čeština
 Українська
 Română

Analysis of Monday's deals:
30M chart of the EUR/USD pair
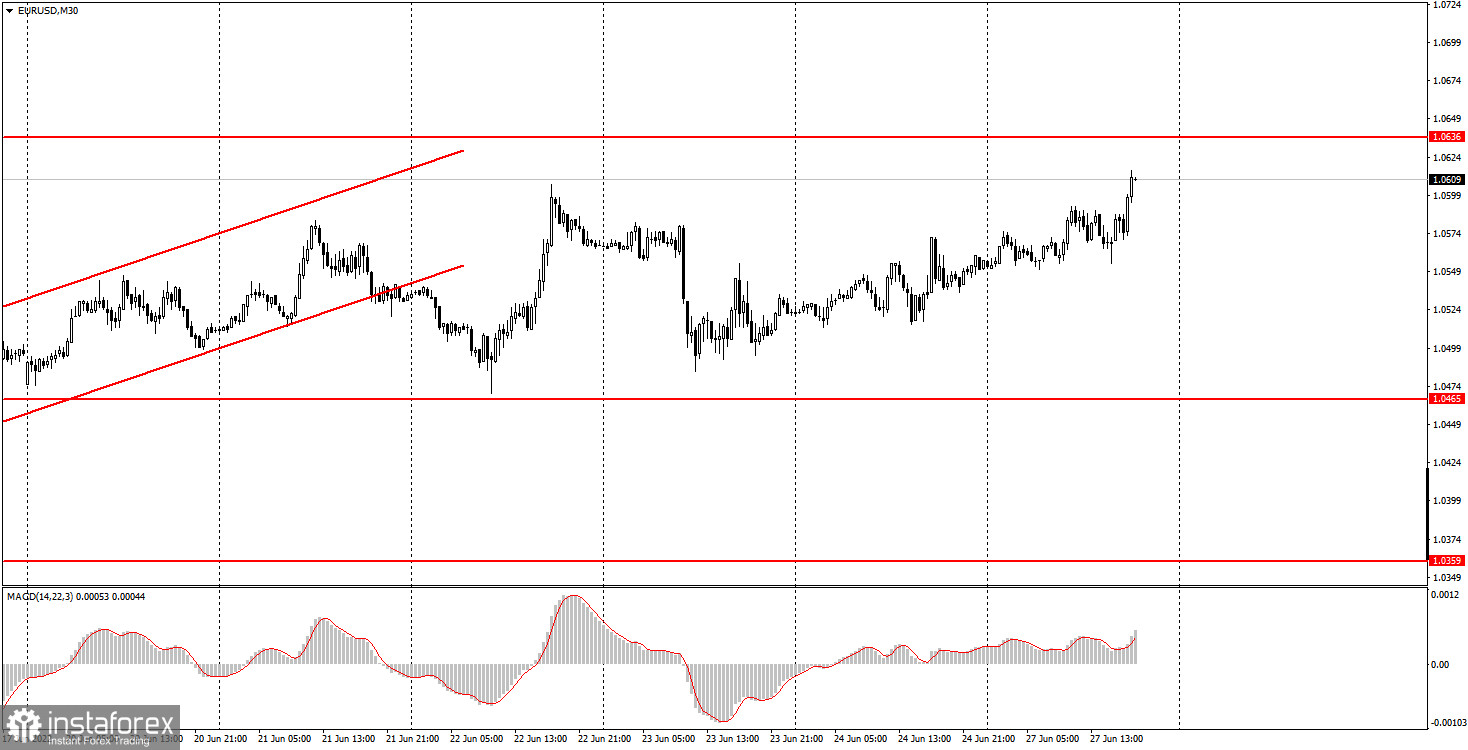
The EUR/USD currency pair traded with a slight increase on Monday, but the entire movement as a whole can still be called a flat or "swing". Today, the pair has taken the first step towards completing an inconvenient movement for traders, but it is not yet possible to draw an unambiguous conclusion that it is completed. Moreover, today we faced for the first time in recent weeks such a phenomenon, when the euro and the pound moved differently. The pound showed a 100% flat during the day, while the euro still rose. Although the macroeconomic background for both pairs was the same. And it was expressed by a single report on orders for durable goods in the US. This report turned out to be stronger than forecasts, so it would be reasonable to assume that the dollar should rise in price. However, in practice it fell. Thus, there is no question of a logical development of statistics. Once again. In general, we can say that the pair continues exclusively technical, corrective growth. We have already said earlier that the euro is capable of creeping up another 100, 200 or 300 points in the coming weeks, but this will not change the current situation at all. And it is not at all clear what the reason for the euro's growth would be after that.
5M chart of the EUR/USD pair
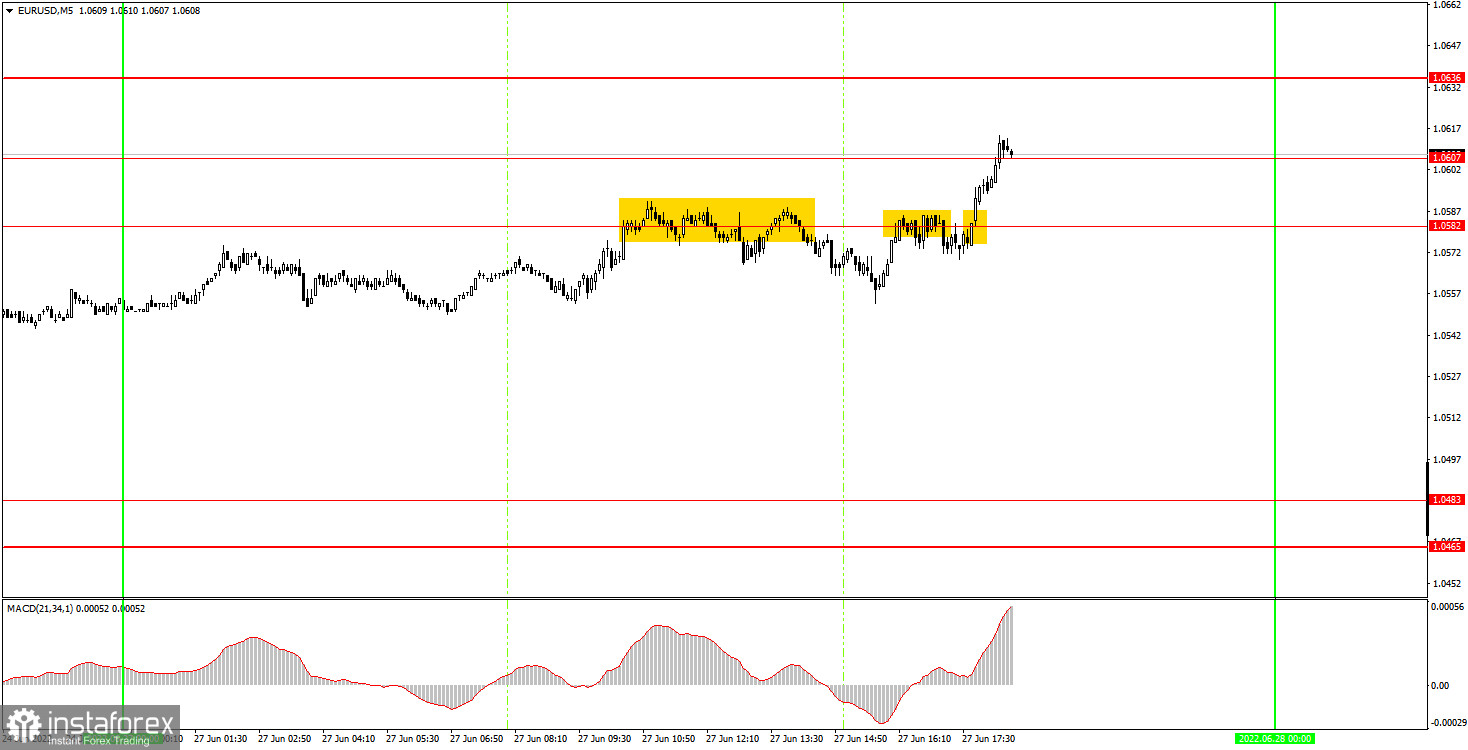
The technical picture does not look the best on the 5-minute timeframe, but at least not completely disastrous. Three trading signals were formed during the day, and all of them are near the level of 1.0582, which, we recall, is a sign of a flat. If after the first signal the pair went down at least 19 points, which was enough to set Stop Loss to breakeven, then after the second it didn't, and the third shouldn't have been worked out at all, since the first two near the same level turned out to be false. As a result, if novice traders even entered the market today, they received a minimal loss, since one deal was closed in it. However, we have repeatedly warned in our recent articles that it is very inconvenient and difficult to trade in a flat. It is still too early to think that the flat is over. The volatility of the pair today was absolutely average - 60 points.
How to trade on Tuesday:
The movement remains absolutely incomprehensible on the 30-minute timeframe. There is a slight upward slope, but this does not make it easier for traders. Thus, we still characterize such a movement as a "swing". Novice traders should be aware of this nature of the movement and not take unnecessary risks. On the 5-minute TF on Tuesday, it is recommended to trade at the levels of 1.0483, 1.0582, 1.0607, 1.0636, 1.0663, 1.0697. When passing 15 points in the right direction, you should set Stop Loss to breakeven. European Central Bank President Christine Lagarde will deliver a speech, so the market can theoretically react to it. However, we do not believe that this reaction will be strong, if at all. So far, the pair is moving up on pure technique and there is a need to correct at least a bit from time to time.
Basic rules of the trading system:
1) The signal strength is calculated by the time it took to form the signal (bounce or overcome the level). The less time it took, the stronger the signal.
2) If two or more deals were opened near a certain level based on false signals (which did not trigger Take Profit or the nearest target level), then all subsequent signals from this level should be ignored.
3) In a flat, any pair can form a lot of false signals or not form them at all. But in any case, at the first signs of a flat, it is better to stop trading.
4) Trade deals are opened in the time period between the beginning of the European session and until the middle of the American one, when all deals must be closed manually.
5) On the 30-minute TF, using signals from the MACD indicator, you can trade only if there is good volatility and a trend, which is confirmed by a trend line or a trend channel.
6) If two levels are located too close to each other (from 5 to 15 points), then they should be considered as an area of support or resistance.
On the chart:
Support and Resistance Levels are the Levels that serve as targets when buying or selling the pair. You can place Take Profit near these levels.
Red lines are the channels or trend lines that display the current trend and show in which direction it is better to trade now.
The MACD indicator (14,22,3) consists of a histogram and a signal line. When they cross, this is a signal to enter the market. It is recommended to use this indicator in combination with trend lines (channels and trend lines).
Important speeches and reports (always contained in the news calendar) can greatly influence the movement of a currency pair. Therefore, during their exit, it is recommended to trade as carefully as possible or exit the market in order to avoid a sharp price reversal against the previous movement.
Beginners on Forex should remember that not every single trade has to be profitable. The development of a clear strategy and money management are the key to success in trading over a long period of time.