 English
  Русский
 Bahasa Indonesia
 Bahasa Malay
 ไทย
ไทย Español
 Deutsch
 Български
 Français
 Tiếng Việt
 中文
中文 বাংলা
বাংলা हिन्दी
 Čeština
 Українська
 Română

Analysis of Monday's deals:
30M chart of the GBP/USD pair
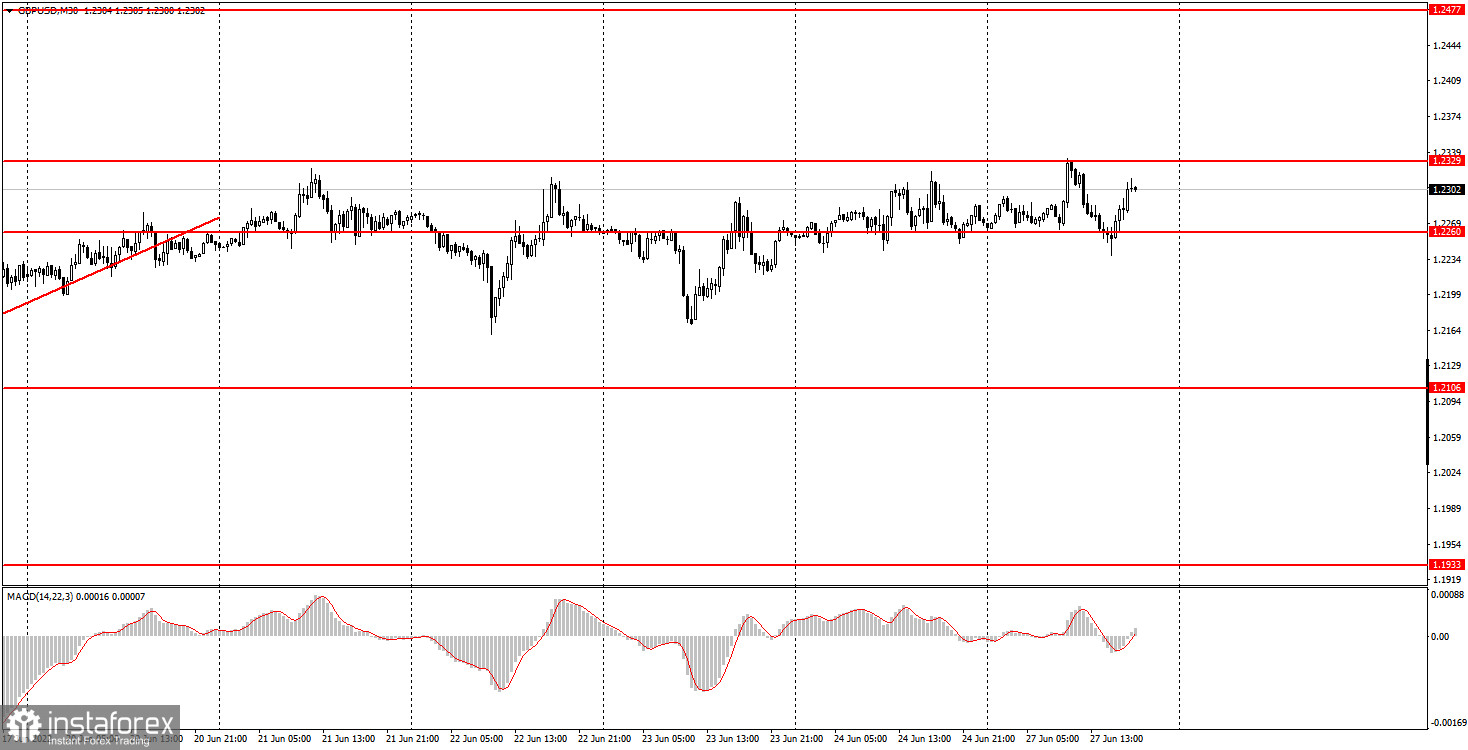
The GBP/USD pair was trading absolutely flat on Monday. If a few days ago the flat was at least wide, then in the last two days the pair has been trading exclusively between the levels of 1.2260 and 1.2329, which is clearly seen in the chart above. Thus, we can not draw new conclusions right now - the flat remains, you need to wait until it ends. Novice traders in the GBP/USD pair had the same report on orders for durable goods in the US at their disposal. We cannot say unequivocally whether the market has completed its work, since a few hours before its release, the dollar had already begun to rise. And when the report was published, the British currency started to rise. However, there is a possibility that some market participants knew the contents of the report in advance. Naturally, we are talking about big players. One way or another, but this event did not help the pound to get out of the horizontal channel. Obviously, sooner or later the price will leave it, but no one knows when and how this will happen. There will be few important fundamental and macroeconomic events in the UK and US this week. If the pound finds the strength to continue growing, then again it will be a purely corrective growth.
5M chart of the GBP/USD pair
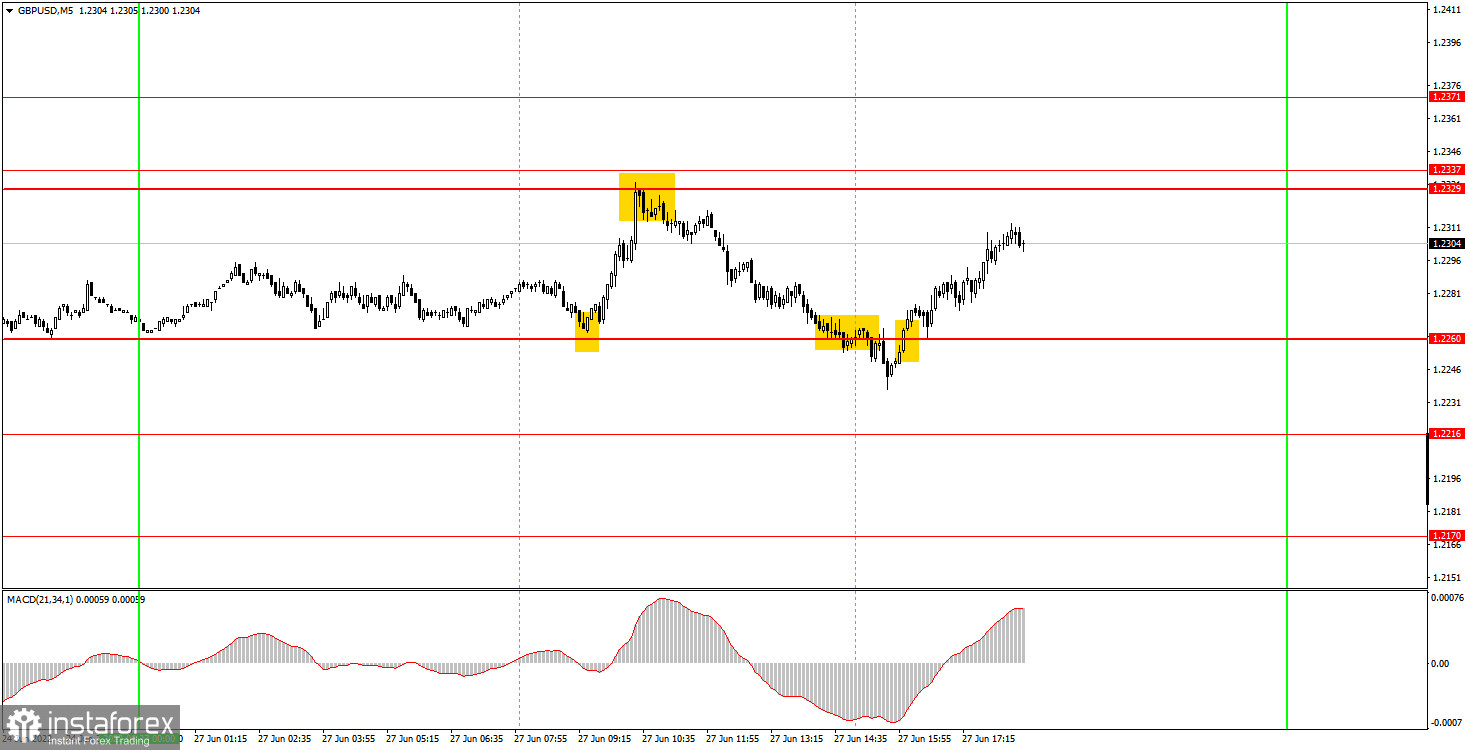
Tuesday's trading signals were not the worst on the 5-minute timeframe, but still there were some false ones. At the very beginning of the European trading session, the pair rebounded from the level of 1.2260 with an error of three points, which is acceptable for opening a deal. Novice traders who opened long positions could make a profit of about 35 points, as the pair subsequently reached the level of 1.2329 perfectly and rebounded from it, having already formed a sell signal. Then the price returned to the level of 1.2260 and even overcame it, so the short position should have been closed on a buy signal about consolidating above the level of 1.2260. It was possible to earn about 38 points. You could also open a deal at the buy signal, but the price did not have time to reach the target level until the evening, so it was necessary to close the longs manually. Another 28 points profit. As a result, it was possible to earn about 100 points almost out of the blue in an absolute flat. This level of profit covered the loss on the euro/dollar pair.
How to trade on Tuesday:
The upward trend formally remains on the 30-minute timeframe, but the pair has been moving only sideways for the last six days. Therefore, it is very inconvenient to trade the pair at the moment, to put it mildly. We advise beginners to be careful and cautious in the near future, because the chaotic movement may take longer. On the 5-minute TF on Tuesday, it is recommended to trade at the levels 1.2170, 1.2216, 1.2260, 1.2329-1.2337, 1.2371, 1.2471-1.2477. When the price passes after opening a deal in the right direction for 20 points, Stop Loss should be set to breakeven. No major events are scheduled for Tuesday in the UK, just like in the US. Therefore, a high probability of a flat will remain during the day. You should still be cautious.
Basic rules of the trading system:
1) The signal strength is calculated by the time it took to form the signal (bounce or overcome the level). The less time it took, the stronger the signal.
2) If two or more deals were opened near a certain level based on false signals (which did not trigger Take Profit or the nearest target level), then all subsequent signals from this level should be ignored.
3) In a flat, any pair can form a lot of false signals or not form them at all. But in any case, at the first signs of a flat, it is better to stop trading.
4) Trade deals are opened in the time period between the beginning of the European session and until the middle of the American one, when all deals must be closed manually.
5) On the 30-minute TF, using signals from the MACD indicator, you can trade only if there is good volatility and a trend, which is confirmed by a trend line or a trend channel.
6) If two levels are located too close to each other (from 5 to 15 points), then they should be considered as an area of support or resistance.
On the chart:
Support and Resistance Levels are the Levels that serve as targets when buying or selling the pair. You can place Take Profit near these levels.
Red lines are the channels or trend lines that display the current trend and show in which direction it is better to trade now.
The MACD indicator (14,22,3) consists of a histogram and a signal line. When they cross, this is a signal to enter the market. It is recommended to use this indicator in combination with trend lines (channels and trend lines).
Important speeches and reports (always contained in the news calendar) can greatly influence the movement of a currency pair. Therefore, during their exit, it is recommended to trade as carefully as possible or exit the market in order to avoid a sharp price reversal against the previous movement.
Beginners on Forex should remember that not every single trade has to be profitable. The development of a clear strategy and money management are the key to success in trading over a long period of time.