 English
  Русский
 Bahasa Indonesia
 Bahasa Malay
 ไทย
ไทย Español
 Deutsch
 Български
 Français
 Tiếng Việt
 中文
中文 বাংলা
বাংলা हिन्दी
 Čeština
 Українська
 Română

When to go long on GBP/USD:
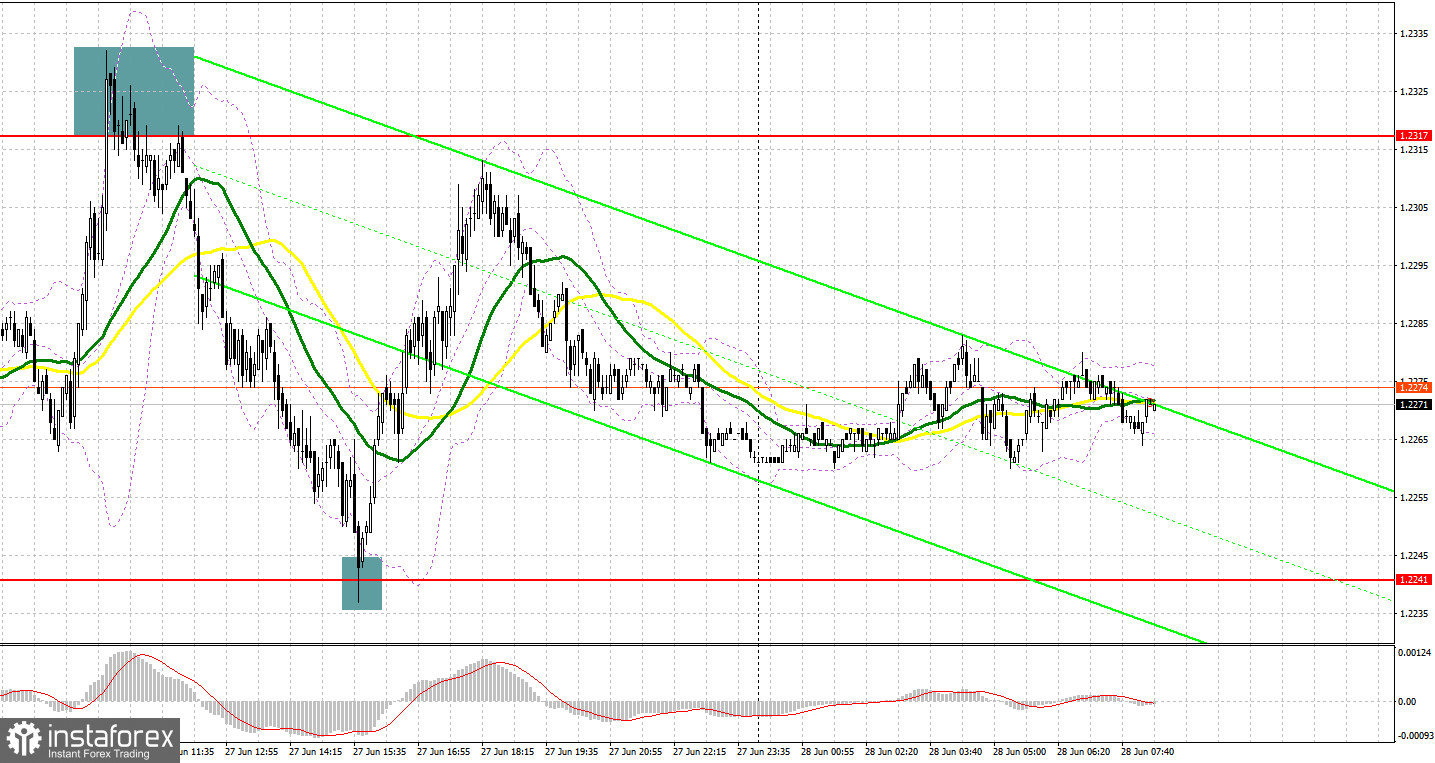
Several good market entry signals were formed yesterday. Let's take a look at the 5-minute chart and see what happened. I paid attention to 1.2317 in my morning forecast and advised making decisions from it. Growth and another unsuccessful attempt to get above 1.2317 by analogy with Friday's attempt to break out of the horizontal channel - all this led to a signal to sell the pound. As a result, the pair fell to the nearest support area 1.2241, which brought about 70 points of profit. The bulls managed to protect 1.2241 in the afternoon and formed a great buy signal from there, which led to a sharp movement of the pound back to 1.2317 - and this is about 50 more points of profit.
COT report:
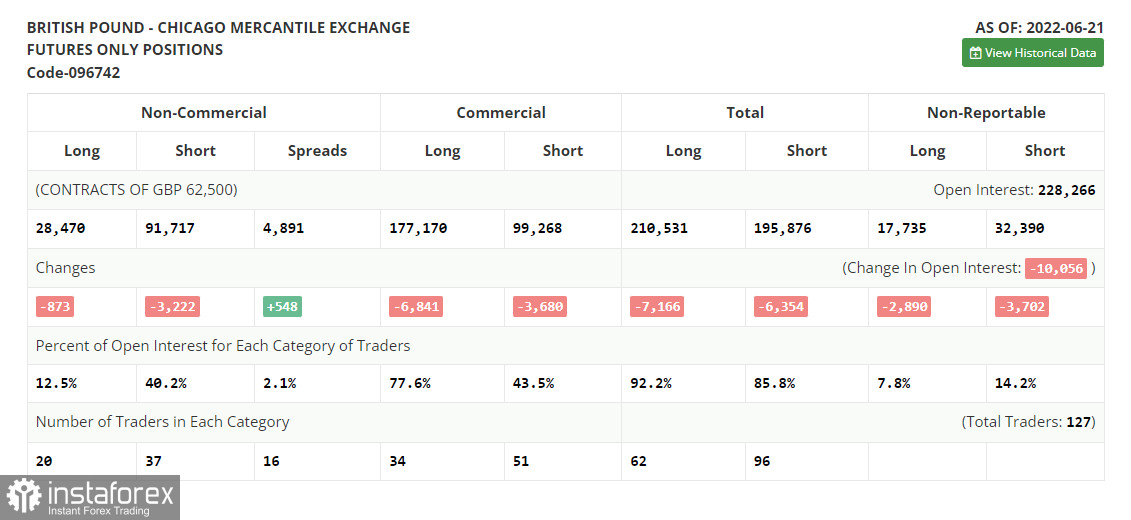
Before analyzing the technical picture of the pound, let's look at what happened in the futures market. The Commitment of Traders (COT) report for June 21 logged a reduction in both long and short positions, but there were more of the latter, which led to a slight decrease in the negative delta. Last week, inflation data in the UK confirmed the correctness of the Bank of England's position in relation to monetary policy. A sharp inflationary jump in May this year was not something surprising for traders, since even according to the official forecasts of the central bank, the consumer price index will exceed 11.0% by the end of the year. The big players, of course, took advantage of the moment and built up long positions as a result of another collapse of the pound, but now, according to the report, we see that there are fewer and fewer people willing to sell at the current lows, which plays on the pound's side. Apparently, the Federal Reserve's policy and its pace of raising interest rates will no longer surprise anyone, so it's time to think about buying cheaper risky assets. The COT report indicated that long non-commercial positions decreased by only 873 to 28,470, while short non-commercial positions decreased by 3,222 to 91,717. level -63,247. The weekly closing price increased and amounted to 1.2295 against 1.1991.
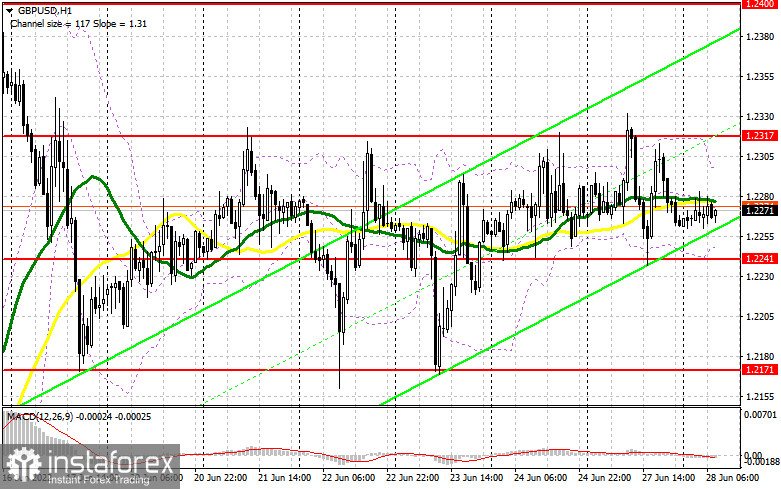
Today there are no statistics on the UK, which will support the pound, provided that the bulls will be able to protect the nearest level of 1.2241 in the first half of the day. Moving averages, playing on the bulls' side, also pass on it, which adds special importance to the level. Only a false breakout there during Monetary Policy Committee member John Cunliffe's speech can give a buy signal that can keep the GBP/USD within the corrective channel, counting on a return of 1.2317. Consolidation above this range and reverse test from top to bottom creates a signal to buy with the goal of a larger recovery to the resistance area of 1.2400. The bulls will obviously take a break in that area. The 1.2452 level is a more distant target, where I recommend taking profits.
In case the pound falls during the European session and the lack of activity at 1.2241, in my opinion, this will add serious problems to the bulls, since the pair's presence in the horizontal channel for more than a week can lead to a new major sell-off of the British pound. In this case, I advise you to postpone long positions until the support of 1.2171. Forming a false breakout there by analogy with what I analyzed above - all this will provide an entry point into long positions, counting on maintaining the pair at least in the horizontal channel. You can buy GBP/USD immediately on a rebound from 1.2102, or even lower - around 1.2030 with the goal of correcting 30-35 points within the day.
When to go short on GBP/USD:
Although the bears are not active, they cope with the task of protecting 1.2317 quite well. However, this is clearly not enough to resume the downward trend, and if this continues, bears may completely lose the initiative. The 1.2317 level has already been tested more than five times, any following update may be the last one. Of course, the best option for opening short positions today would be a false breakout forming all at the same 1.2317, which was formed two weeks earlier. This will provide an entry point for the pair to fall and then break through the support at 1.2241, which also fails to be done during the last trading days. A bigger struggle will unfold for this level, as the bulls will try to build the lower border of the new upward corrective channel there. Only a breakdown and reverse test of this level from below will bring the GBP/USD down to a low of 1.2171, leaving a good opportunity to update support at 1.2102. The 1.2030 level is a more distant target, where I recommend taking profits.
If the pair grows during the European session and there are no bears at 1.2317, the bears may lose the initiative. In this case, I advise you to postpone short positions until 1.2400. I advise you to sell the pound there only after a false breakout. You can open short positions immediately for a rebound from the high of 1.2452, or even higher - from 1.2484, based on the correction of the pair down by 30-35 points within the day.
I recommend to read:
Indicator signals:
Moving averages
Trading is conducted just above 30 and 50 moving averages, which indicates an attempt by the bulls to resume the growth of the pair.
Note: The period and prices of moving averages are considered by the author on the H1 hourly chart and differs from the general definition of the classic daily moving averages on the daily D1 chart.
Bollinger Bands
A breakthrough of the lower border of the indicator in the area of 1.2241 will increase pressure on the pair. If the pair grows, the upper border of the indicator around 1.2300 will act as resistance.
Description of indicators
- Moving average (moving average, determines the current trend by smoothing out volatility and noise). Period 50. It is marked in yellow on the chart.
- Moving average (moving average, determines the current trend by smoothing out volatility and noise). Period 30. It is marked in green on the chart.
- MACD indicator (Moving Average Convergence/Divergence — convergence/divergence of moving averages) Quick EMA period 12. Slow EMA period to 26. SMA period 9
- Bollinger Bands (Bollinger Bands). Period 20
- Non-commercial speculative traders, such as individual traders, hedge funds, and large institutions that use the futures market for speculative purposes and meet certain requirements.
- Long non-commercial positions represent the total long open position of non-commercial traders.
- Short non-commercial positions represent the total short open position of non-commercial traders.
- Total non-commercial net position is the difference between short and long positions of non-commercial traders.