 English
  Русский
 Bahasa Indonesia
 Bahasa Malay
 ไทย
ไทย Español
 Deutsch
 Български
 Français
 Tiếng Việt
 中文
中文 বাংলা
বাংলা हिन्दी
 Čeština
 Українська
 Română

Details of the economic calendar from June 27
US durable goods orders data surprised traders with a divergence in expectations. Forecasts predicted a decline of 0.3% in May, but actual data showed orders increased by 0.7%.
Analysis of trading charts from June 27
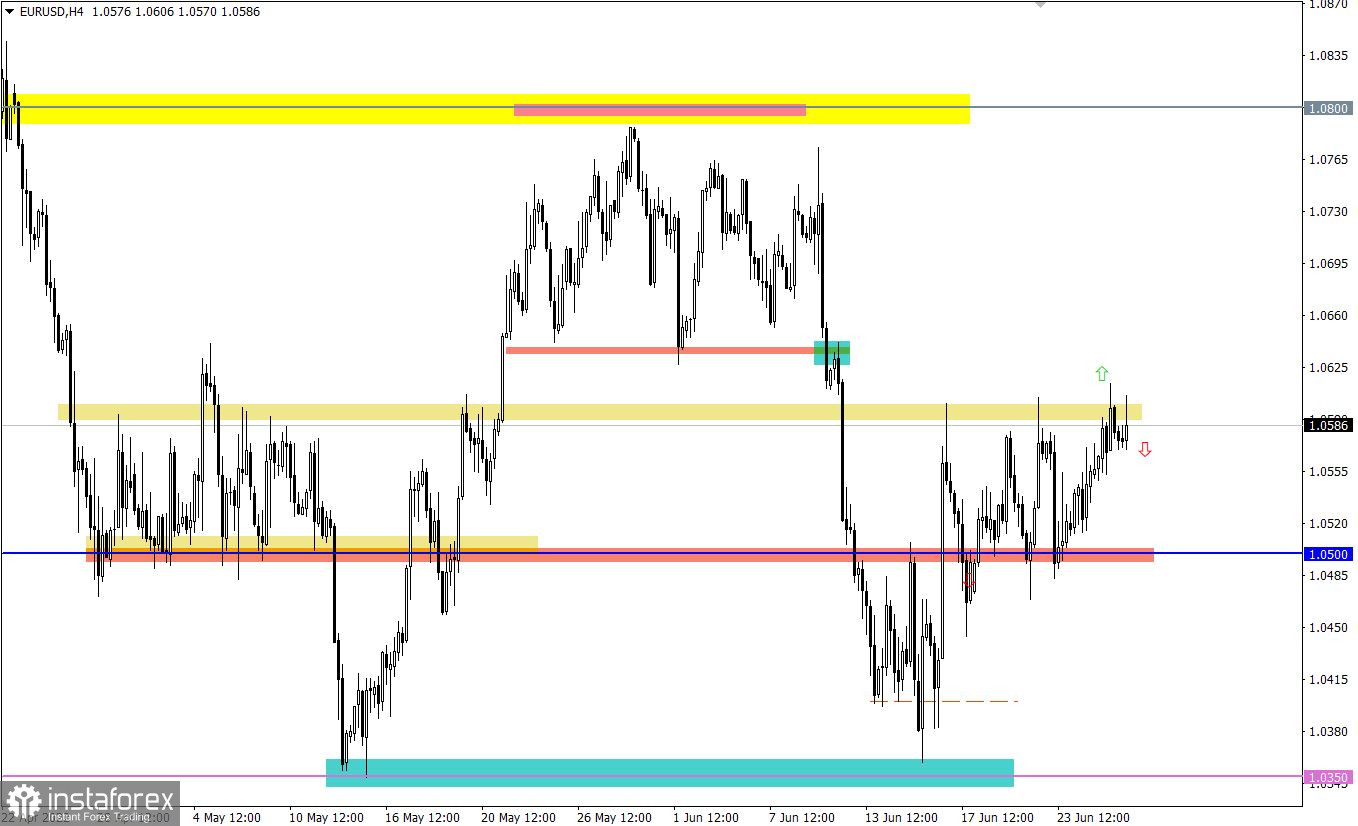
The EURUSD currency pair slowed down the upward pace after the price approached the upper flat line 1.0500/1.0600. This move led to a reduction in the volume of long positions and, as a result, a pullback.
The GBPUSD currency pair has been moving within the upper border of the side channel 1.2150/1.2320 for the second day in a row, which indicates the process of accumulation of trading forces.
Economic calendar for June 28
Today the macroeconomic calendar is empty, the only thing that can affect the market is political statements during the G7 summit.
Trading plan for EUR/USD on June 28
The short-term side channel is still relevant in the market, for this reason, traders allow the tactics of working on a price rebound.
An alternative scenario considers a breakout strategy, where holding the price outside of one or another boundary in a four-hour period will indicate a subsequent path.
Trading plan for GBP/USD on June 28
In this situation, the compression of the amplitude within the current flat serves as a lever that focuses abundant attention on the part of speculators. Thus, the market may soon accelerate, which will lead to one of the possible scenarios:
Price rebound from the upper border of the flat, followed by a move towards the values of 1.2200–1.2150.
The breakdown of the upper border of the flat, where a buy signal will appear if the price holds above 1.2340 in a four-hour period.
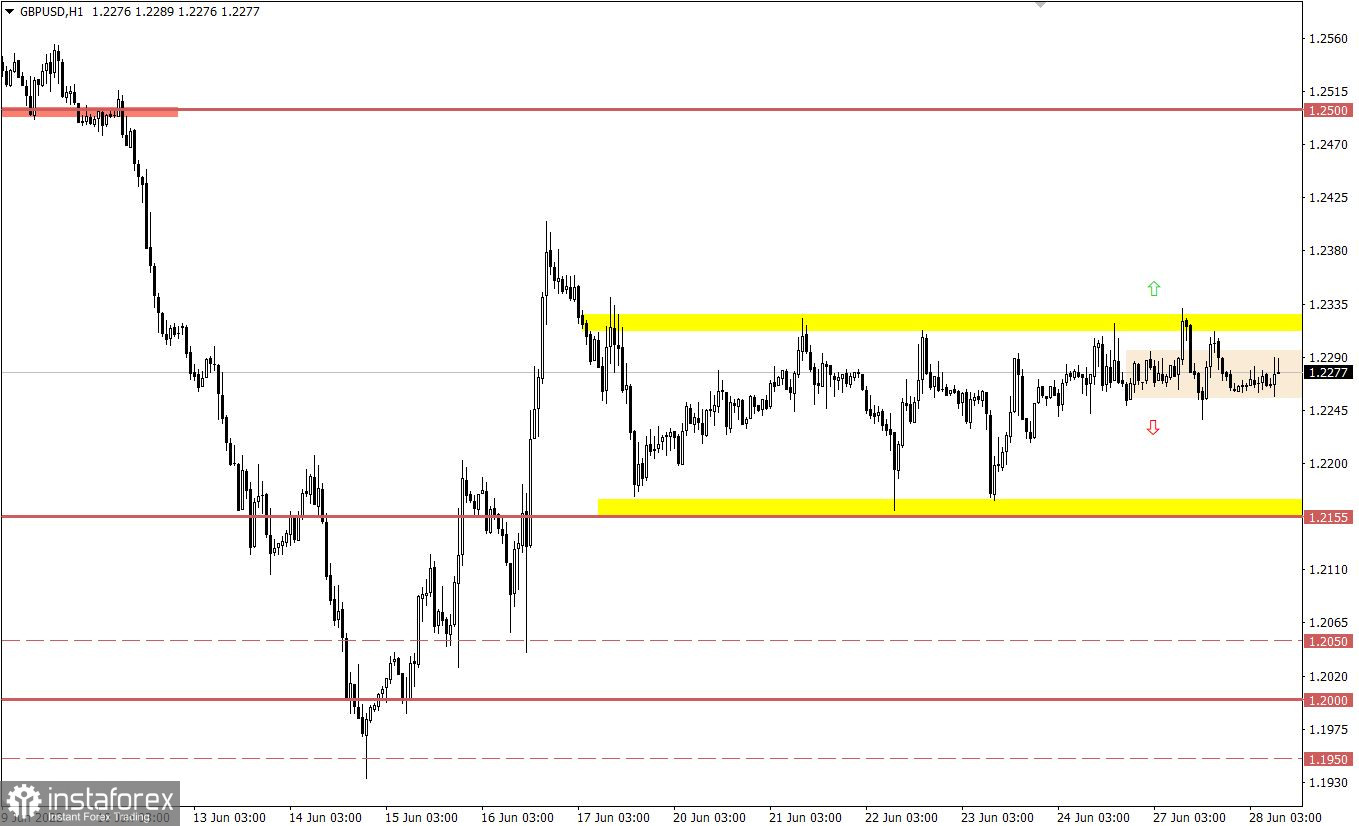
What is reflected in the trading charts?
A candlestick chart view is graphical rectangles of white and black light, with sticks on top and bottom. When analyzing each candle in detail, you will see its characteristics of a relative period: the opening price, closing price, and maximum and minimum prices.
Horizontal levels are price coordinates, relative to which a stop or a price reversal may occur. These levels are called support and resistance in the market.
Circles and rectangles are highlighted examples where the price of the story unfolded. This color selection indicates horizontal lines that may put pressure on the quote in the future.
The up/down arrows are the reference points of the possible price direction in the future.