 English
  Русский
 Bahasa Indonesia
 Bahasa Malay
 ไทย
ไทย Español
 Deutsch
 Български
 Français
 Tiếng Việt
 中文
中文 বাংলা
বাংলা हिन्दी
 Čeština
 Українська
 Română

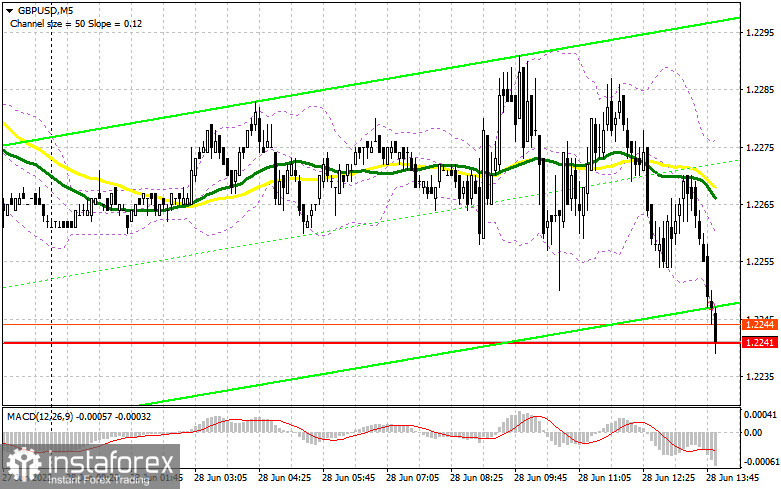
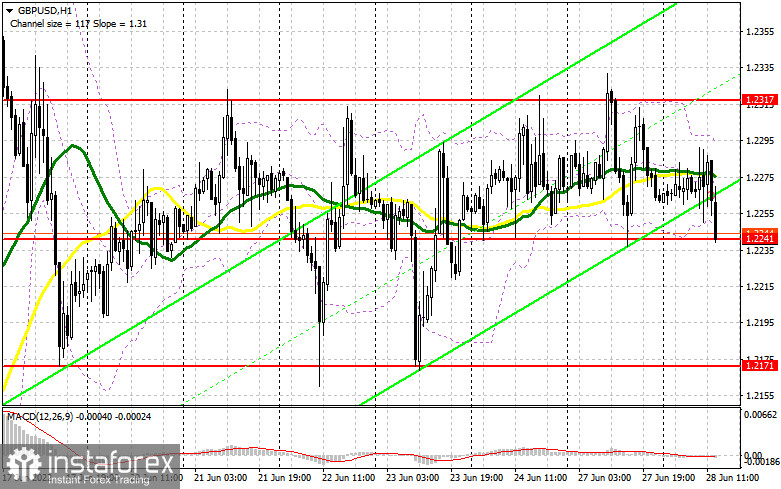
In my morning forecast, I paid attention to the 1.2317 level and recommended making decisions from it. Let's look at the 5-minute chart and figure out what happened there. The attempt to grow to 1.2317 failed, as volatility during the European session was extremely low. At the time of preparation of the material, the pair declined to the support area of 1.2241, which may lead to the formation of signals to enter the market. From a technical point of view, nothing has changed, nor has the strategy itself changed. And what were the entry points for the euro?
To open long positions on GBP/USD, you need:
The lack of statistics on the pound and the low trading volume indicates a wait-and-see attitude of both buyers and sellers. During the US session, data on the balance of foreign trade in US goods and the consumer confidence index were released today, which may return pressure on the dollar, provided that the reports turn out to be worse than economists. If the figures coincide with the forecasts, most likely the pair will continue trading in the side channel with the prospect of protecting the support of 1.2241. The formation of a false breakdown there will give a signal to open long positions in the expectation of growth to the nearest level of 1.2317. In the morning forecast, I said that this level is critically important for bulls since by returning it under control, it will be possible to count on the resumption of the bull market formed on June 14. A breakout and a top-down test of 1.2317 will give a buy signal based on the 1.2400 update. A similar breakthrough at this level will lead to another entry point into long positions with the prospect of reaching 1.2452, where I recommend fixing the profits. A more distant target will be the 1.2484 area. If GBP/USD falls and there are no buyers at 1.2241 in the afternoon, the pressure on the pair will increase. In this scenario, I advise you to open new long positions only on a false breakout from the lower border of the side channel 1.2171. You can buy GBP/USD immediately for a rebound from 1.2102, or even lower – around 1.2030 with the aim of correction of 30-35 points within a day.
To open short positions on GBP/USD, you need:
The bears have done everything possible to get back into the market. Now the focus is on 1.2241 and fixing below this range. However, in case of weak US data, it will be possible to observe another upward jerk of the pound. Therefore, only the formation of a false breakdown at 1.2317 will lead to the formation of a sell signal with the prospect of a return to 1.2241. Its breakthrough will lead to a sell-off and a return of GBP/USD to the area of the lower border of the side channel. However, only a consolidation below 1.2241 and a reverse test from the bottom up will give an entry point into short positions. A more distant target will be the 1.2102 area, the test of which will testify to the defeat of buyers. With the option of GBP/USD growth and the absence of bears at 1.2317, we will only have to count on the nearest resistance of 1.2400. A false breakout at this level will give a good entry point into short positions in the expectation of at least some downward correction. If there is no activity at 1.2400, another upward jerk may occur against the background of the demolition of stop orders of speculative sellers. In this case, I advise you to postpone short positions to 1.2452. But even there, I advise selling the pound only in case of a false breakdown, since going beyond this range will increase demand for GBP / USD. Short positions can be viewed immediately for a rebound from 1.2484, or even higher – from 1.2516, counting on the pair's rebound down by 30-35 points inside the day.
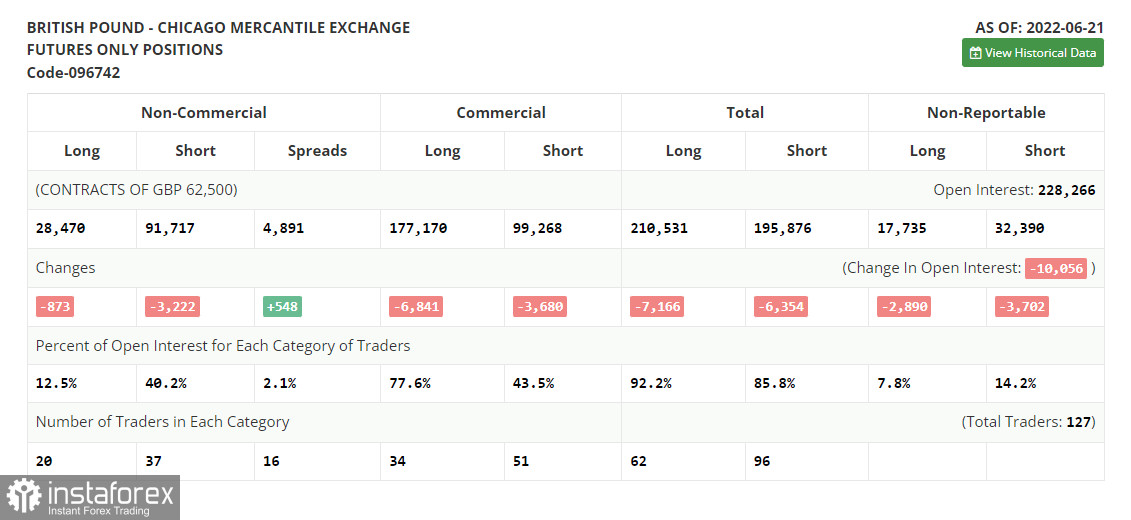
The COT report (Commitment of Traders) for June 21 recorded a reduction in both long and short positions, but the latter turned out to be more, which led to a slight decrease in the negative delta. Last week, inflation data in the UK confirmed the correctness of the Bank of England's position on monetary policy. The sharp inflationary jump in May of this year was nothing surprising for traders since even according to the official forecasts of the regulator, the consumer price index will exceed 11.0% by the end of the year. The big players, of course, took advantage of the moment and increased their long positions as a result of another collapse of the pound, but now, according to the report, we see that fewer people are willing to sell at current lows, which plays on the side of the British pound. No one will be surprised by the policy of the Federal Reserve System and its rate of interest rate increases, so it's time to think about buying cheaper risky assets. The COT report indicates that long non-commercial positions decreased by only 873 to the level of 28,470, while short non-commercial positions decreased by 3,222 to the level of 91,717. This led to a decrease in the negative value of the non-commercial net position from the level of -65,596 to the level of -63,247. The weekly closing price rose to 1.2295 against 1.1991.
- Moving average (moving average determines the current trend by smoothing out volatility and noise). Period 50. The graph is marked in yellow.
- Moving average (moving average determines the current trend by smoothing out volatility and noise). Period 30. The graph is marked in green.
- MACD indicator (Moving Average Convergence / Divergence - moving average convergence/divergence) Fast EMA period 12. Slow EMA period 26. SMA period 9
- Bollinger Bands (Bollinger Bands). Period 20
- Non-profit speculative traders, such as individual traders, hedge funds, and large institutions use the futures market for speculative purposes and to meet certain requirements.
- Long non-commercial positions represent the total long open position of non-commercial traders.
- Short non-commercial positions represent the total short open position of non-commercial traders.
- Total non-commercial net position is the difference between the short and long positions of non-commercial traders.