 English
  Русский
 Bahasa Indonesia
 Bahasa Malay
 ไทย
ไทย Español
 Deutsch
 Български
 Français
 Tiếng Việt
 中文
中文 বাংলা
বাংলা हिन्दी
 Čeština
 Українська
 Română

Several ideal market entry points were formed yesterday. Let's take a look at the 5-minute chart and see what happened. I paid attention to the 1.2152 level in my morning forecast and advised making decisions from it. An attempt to rise and build an upward corrective momentum failed before it even started. A false breakout at 1.2152 resulted in a signal for shorts, which eventually resulted in a massive sell-off of over 50 points. After falling to the nearest support area of 1.2098 in the afternoon, the bulls managed to quickly take control of the market, and form a false breakout there which created an excellent entry point for buying the pound. As a result, the pair rose by more than 60 points. Selling at the price of 1.2159 on a false breakout did not bring much profit.
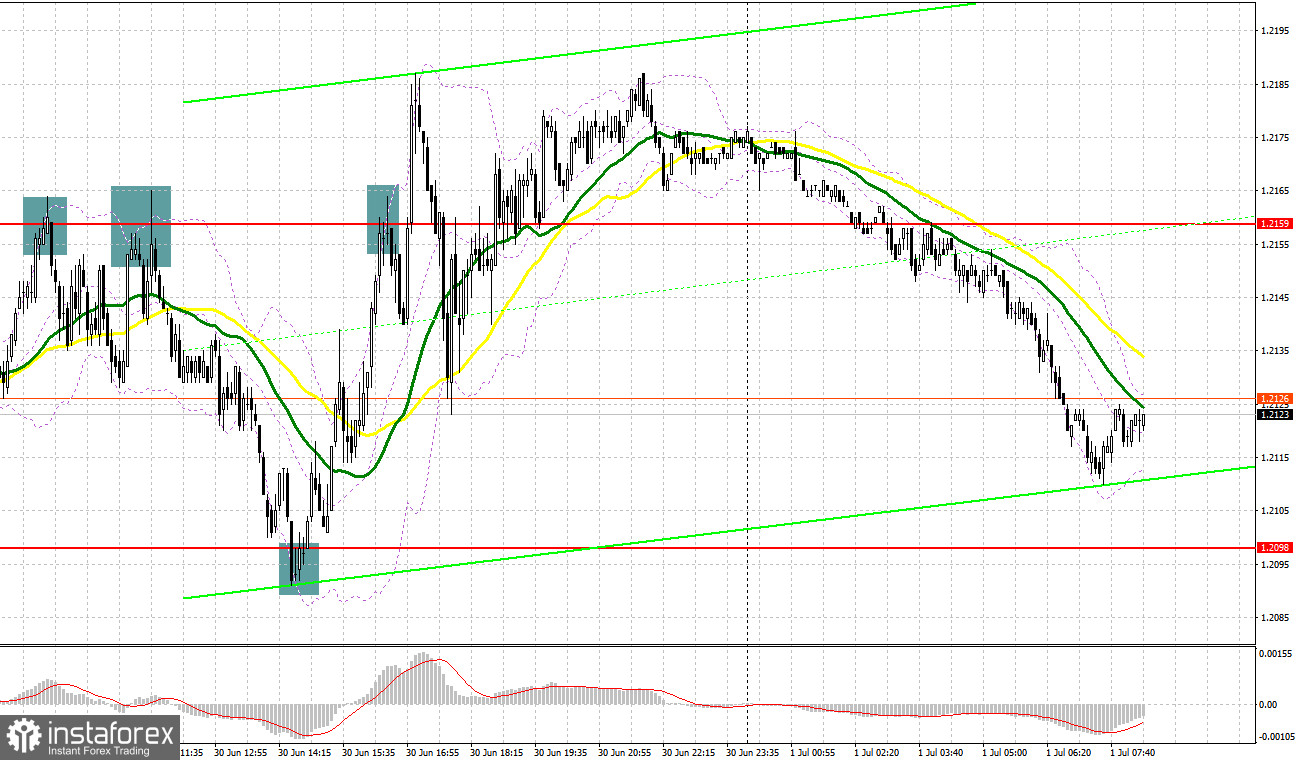
When to go long on GBP/USD:
The pound remains within the horizontal channel, which is good for bulls on the one hand, but on the other hand, it allows the bears to take a break and redistribute their forces, counting on another breakthrough to the area of annual lows. Data on the index of business activity in the manufacturing sector in the UK will be released today. Only a very serious discrepancy with economists' forecasts can somehow negatively affect the British pound, which will lead to a breakthrough of the lower boundary of the new horizontal channel at 1.2094. A lot depends on this level, so I put such an emphasis on it.
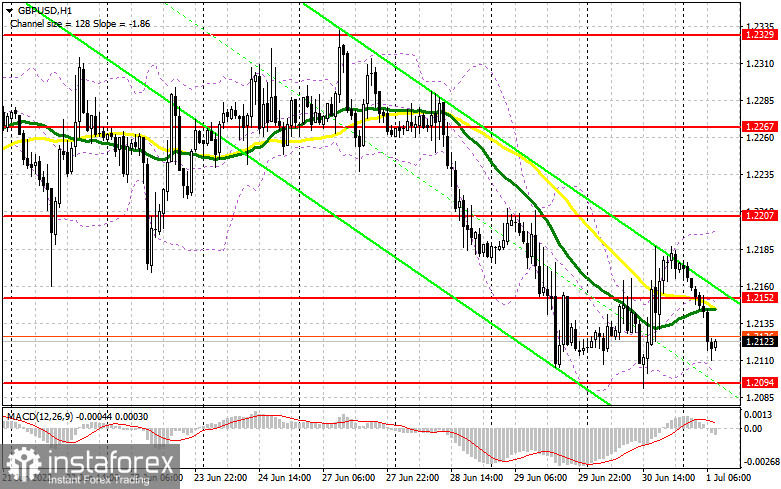
Bulls will have no choice but to count on protecting 1.2094, because if you miss it, you can say goodbye to the hope for a speedy recovery of the pair. An update of this level and forming a false breakout on it will be the first signal to open long positions with the goal of moving up to the area of 1.2152, where the moving averages are, playing on the bears' side. A breakthrough and downward test of 1.2152 will provide a signal for longs with the goal of updating 1.2207. A similar breakthrough of this level will lead to another entry point into long positions with the prospect of exiting at 1.2267, where I recommend taking profits. A more distant target will be the area of 1.2329, but it's too early to talk about it, since the bears are in control of the market.
In case GBP/USD falls and there are no bulls at 1.2094, and for this the bears have everything they need, they only need some new trigger - all this will greatly affect the technical picture, which will increase pressure on the pair. In this case, I recommend postponing long positions until the next support at 1.2042. I advise you to buy there only on a false breakout. You can open long positions on GBP/USD immediately for a rebound from 1.1993, or even lower - in the area of 1.1938 with the goal of correcting 30-35 points within the day.
When to go short on GBP/USD:
The bears tried to break below 1.2094 yesterday, but it was not successful. However, it is worth paying tribute, the bulls also failed to seize the initiative, which kept trading within the horizontal channel, from which traders will try to get out today. In case the pound grows once we receive the data on activity in the manufacturing sector, forming a false breakout at the level of 1.2152 will provide the first entry point into short positions in continuation of the bearish scenario and with the prospect of a return to 1.2094. Consolidating below 1.2094 and a reverse test from the bottom up will greatly affect the bulls' stop orders, which create another entry point for short positions with the goal of further decline to 1.2042, where I recommend partially taking profits. A more distant target will be the area of 1.1993, and there we can just barely reach the annual low of 1.1938.
In case GBP/USD grows and bears are not active at 1.2152, it remains only to rely on strong statistics from the US and the nearest resistance at 1.2207. As practice shows, we can observe short positions on the pound during the US trading session. A false breakout at 1.2207 would provide a good short entry point for the pair to bounce down. In case traders are not active at 1.2207, another upsurge may occur amid the removal of stop orders of speculative sellers. In this case, I advise you to postpone short positions to 1.2267. You can sell GBP/USD immediately for a rebound from 1.2329, counting on the pair's rebound down by 30-35 points within the day.
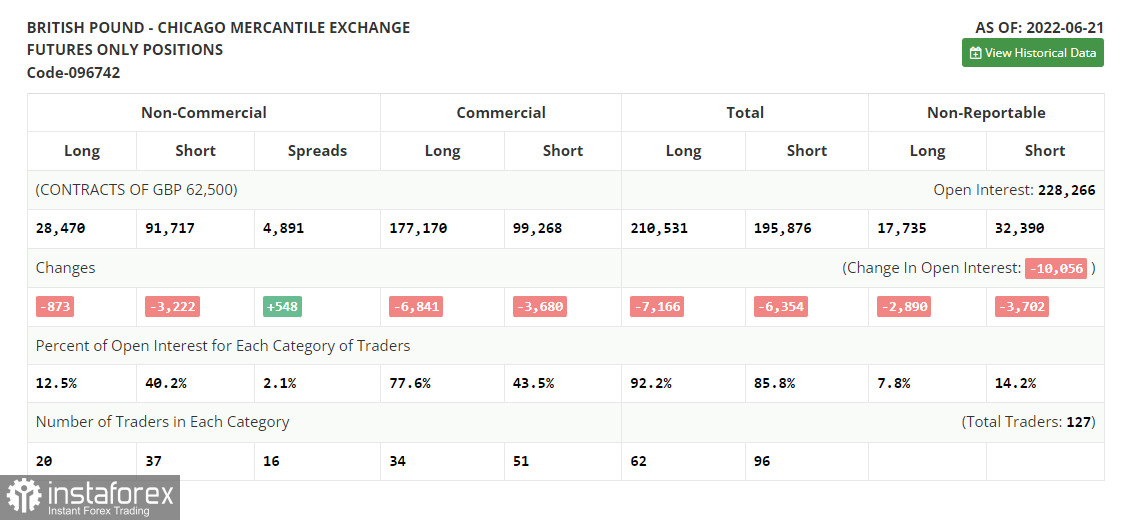
COT report:
Before analyzing the technical picture of the pound, let's look at what happened in the futures market. The Commitment of Traders (COT) report for June 21 logged a reduction in both long and short positions, but there were more of the latter, which led to a slight decrease in the negative delta. Last week, inflation data in the UK confirmed the correctness of the Bank of England's position in relation to monetary policy. A sharp inflationary jump in May this year was not something surprising for traders, since even according to the official forecasts of the central bank, the consumer price index will exceed 11.0% by the end of the year. The big players, of course, took advantage of the moment and built up long positions as a result of another collapse of the pound, but now, according to the report, we see that there are fewer and fewer people willing to sell at the current lows, which plays on the pound's side. Apparently, the Federal Reserve's policy and its pace of raising interest rates will no longer surprise anyone, so it's time to think about buying cheaper risky assets. The COT report indicated that long non-commercial positions decreased by only 873 to 28,470, while short non-commercial positions decreased by 3,222 to 91,717. level -63,247. The weekly closing price increased and amounted to 1.2295 against 1.1991.
I recommend to read:
Indicator signals:
Moving averages
Trading is below the 30 and 50-day moving averages, indicating a continuation of the bear market.
Note: The period and prices of moving averages are considered by the author on the H1 hourly chart and differs from the general definition of the classic daily moving averages on the daily D1 chart.
Bollinger Bands
In case of growth, the area of 1.2200 will act as resistance. In case the pair goes down, the lower border of the indicator around 1.2100 will act as support.
Description of indicators
- Moving average (moving average, determines the current trend by smoothing out volatility and noise). Period 50. It is marked in yellow on the chart.
- Moving average (moving average, determines the current trend by smoothing out volatility and noise). Period 30. It is marked in green on the chart.
- MACD indicator (Moving Average Convergence/Divergence — convergence/divergence of moving averages) Quick EMA period 12. Slow EMA period to 26. SMA period 9
- Bollinger Bands (Bollinger Bands). Period 20
- Non-commercial speculative traders, such as individual traders, hedge funds, and large institutions that use the futures market for speculative purposes and meet certain requirements.
- Long non-commercial positions represent the total long open position of non-commercial traders.
- Short non-commercial positions represent the total short open position of non-commercial traders.
- Total non-commercial net position is the difference between short and long positions of non-commercial traders.