 English
  Русский
 Bahasa Indonesia
 Bahasa Malay
 ไทย
ไทย Español
 Deutsch
 Български
 Français
 Tiếng Việt
 中文
中文 বাংলা
বাংলা हिन्दी
 Čeština
 Українська
 Română

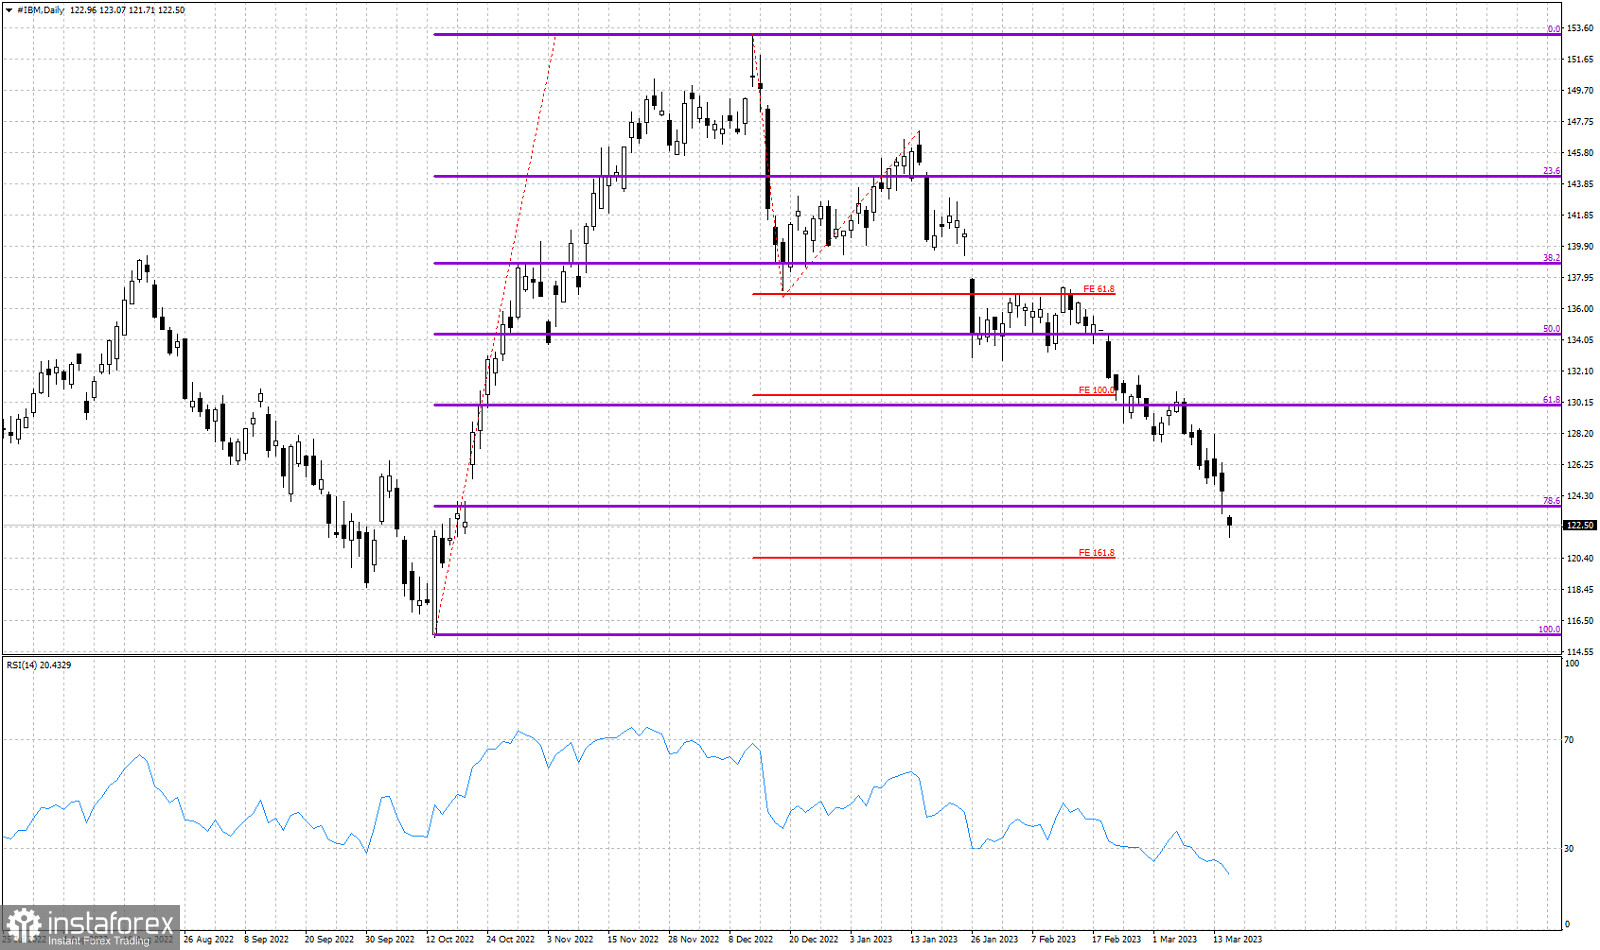
Violet lines- Fibonacci retracements
Red lines- Fibonacci extension levels
We have been bearish IBM stock for some time now. Price remains in a bearish short-term trend making lower lows and lower highs. Price has surpassed the 61.8% Fibonacci support level and the 100% extension target. This was our second target area. Price is now approaching the 3rd target area of the 161.8% Fibonacci extension. Price today is trading below the 78.6% Fibonacci support level. Such price action is bearish and there are increased chances that over the coming weeks price will eventually break below October 2022 lows. The RSI is at oversold levels. A short-term bounce is justified, but we believe only as a pause to the downtrend.