 English
  Русский
 Bahasa Indonesia
 Bahasa Malay
 ไทย
ไทย Español
 Deutsch
 Български
 Français
 Tiếng Việt
 中文
中文 বাংলা
বাংলা हिन्दी
 Čeština
 Українська
 Română

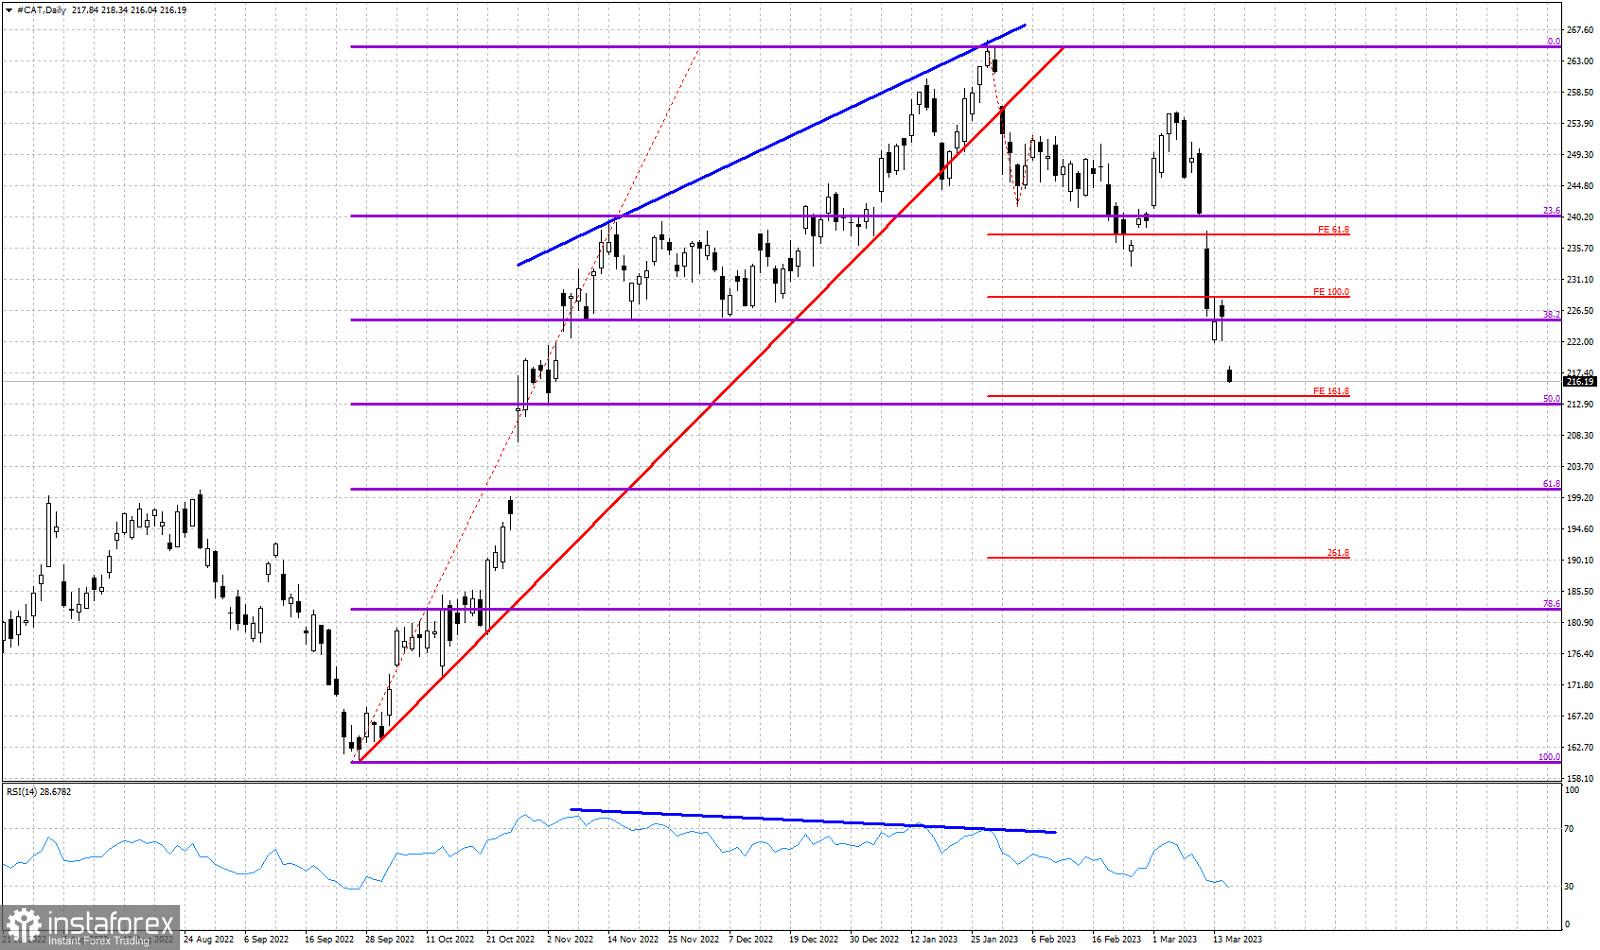
Blue lines- bearish divergence
Red lines horizontal- Fibonacci extension targets
Red upward line- support trend line (broken)
Violet lines- Fibonacci retracement levels
We have been bearish CAT stock for some time now. Price recently made a strong bounce towards $255 only to form a lower high and then turned lower to new lows. Price has now reached very close to the 161.8% Fibonacci extension target which coincides with the 61.8% Fibonacci retracement level. Short-term trend remains bearish as price continues making lower lows and lower highs. The 61.8% Fibonacci level is considered important support and possible bounce/turn around level. The RSI is still not at oversold levels. Bears remain in control of the trend.