 English
  Русский
 Bahasa Indonesia
 Bahasa Malay
 ไทย
ไทย Español
 Deutsch
 Български
 Français
 Tiếng Việt
 中文
中文 বাংলা
বাংলা हिन्दी
 Čeština
 Українська
 Română

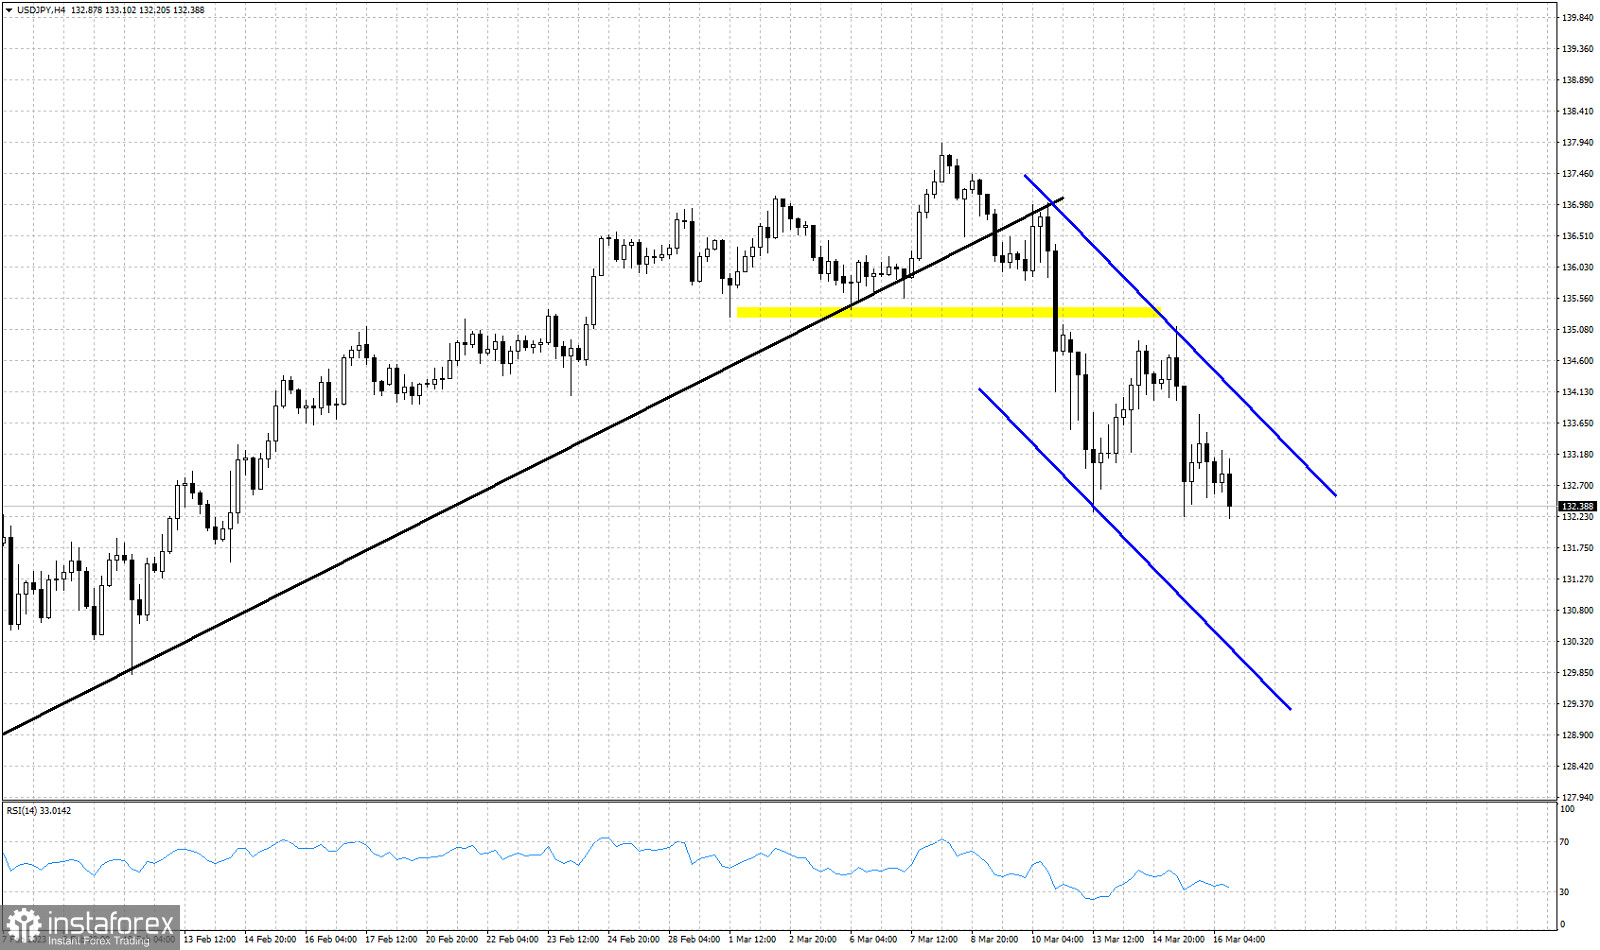
Black line- support trend line (broken)
Yellow rectangle- horizontal support (broken)
Blue lines- bearish channel
USDJPY remains under pressure. Price continues making lower lows and lower highs. Yesterday's high at 135.16 was a lower high and connecting it with the recent high of 137.01 we are creating a bearish channel. Price is close to breaking below yesterday's low. This would be an added sign of weakness that would imply more downside for USDJPY. As long as price is trading inside the blue downward sloping channel, we remain bearish. Resistance is at 134.10. Bulls need to break above this level and stay above it. Next major resistance is at 135.30. Previous support is now resistance.