 English
  Русский
 Bahasa Indonesia
 Bahasa Malay
 ไทย
ไทย Español
 Deutsch
 Български
 Français
 Tiếng Việt
 中文
中文 বাংলা
বাংলা हिन्दी
 Čeština
 Українська
 Română

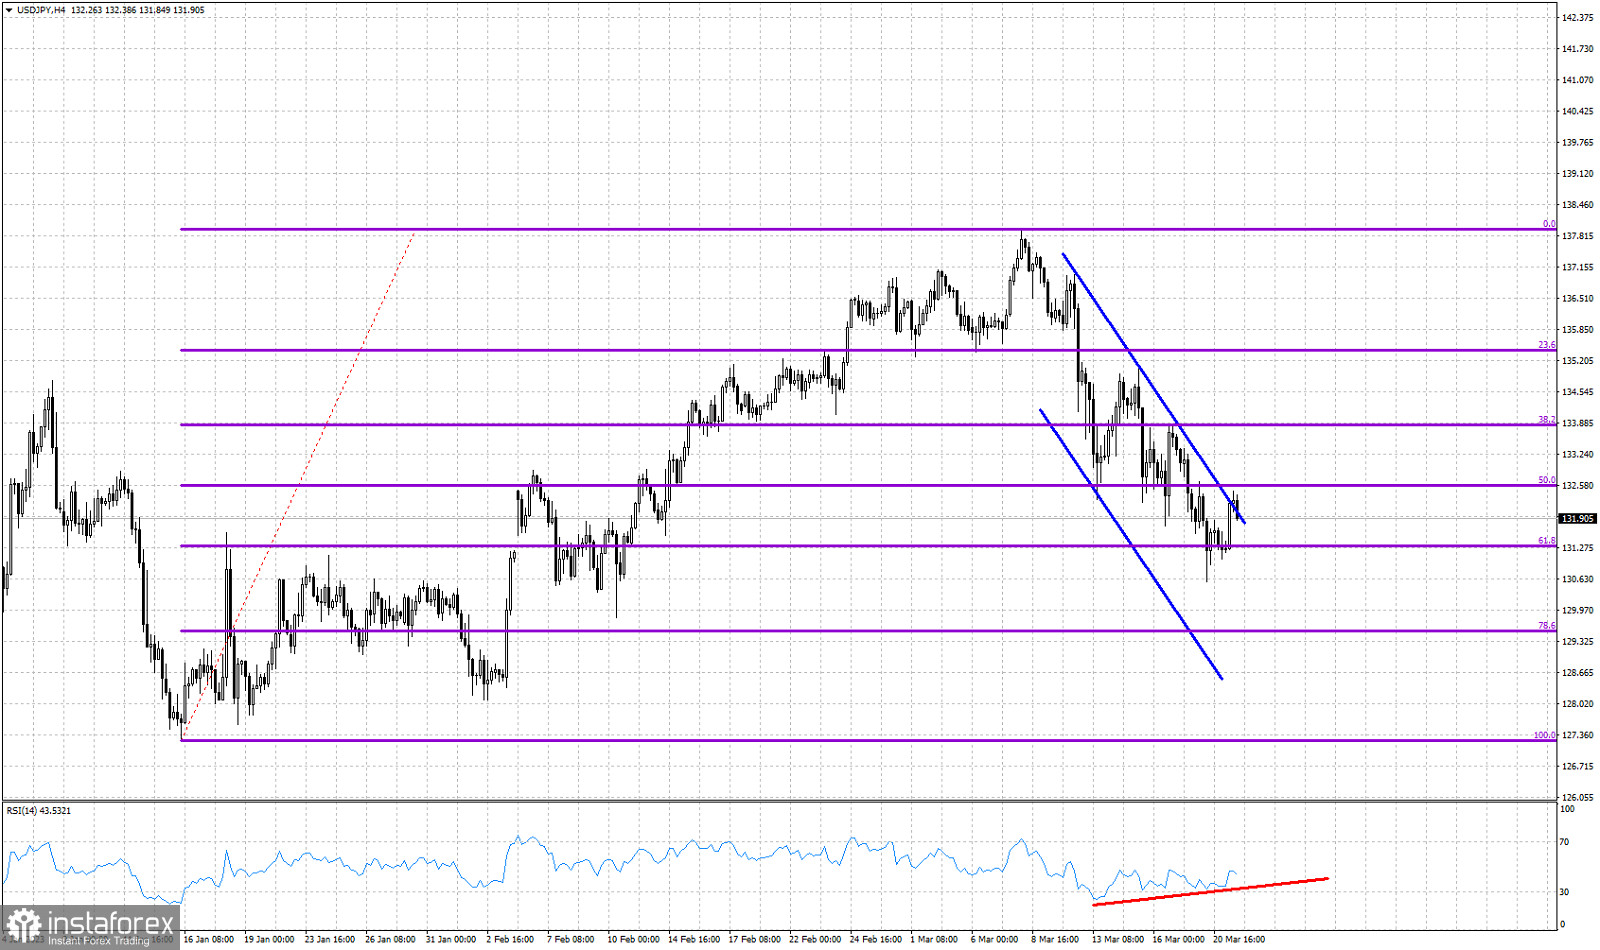
Blue lines- Bearish channel
Red line- bullish RSI divergence
Violet lines- Fibonacci retracement
In our USDJPY analysis yesterday we noted that there were increased chances of a bounce. Price made a low at 130.56 and is now challenging the upper channel boundary. Price technically remains in a bearish trend as it is still inside the downward sloping channel. Price however has started forming higher highs and higher lows. The bullish RSI divergence, combined with a reversal from the 61.8% Fibonacci retracement could produce an explosive bullish signal if price manages to break out above the bearish channel. Support is found at 131.05 low we made today. Bulls need to defend this level. Failure to do so will push price to new lows towards 130-129.