 English
  Русский
 Bahasa Indonesia
 Bahasa Malay
 ไทย
ไทย Español
 Deutsch
 Български
 Français
 Tiếng Việt
 中文
中文 বাংলা
বাংলা हिन्दी
 Čeština
 Українська
 Română

Platinum (#PLF):
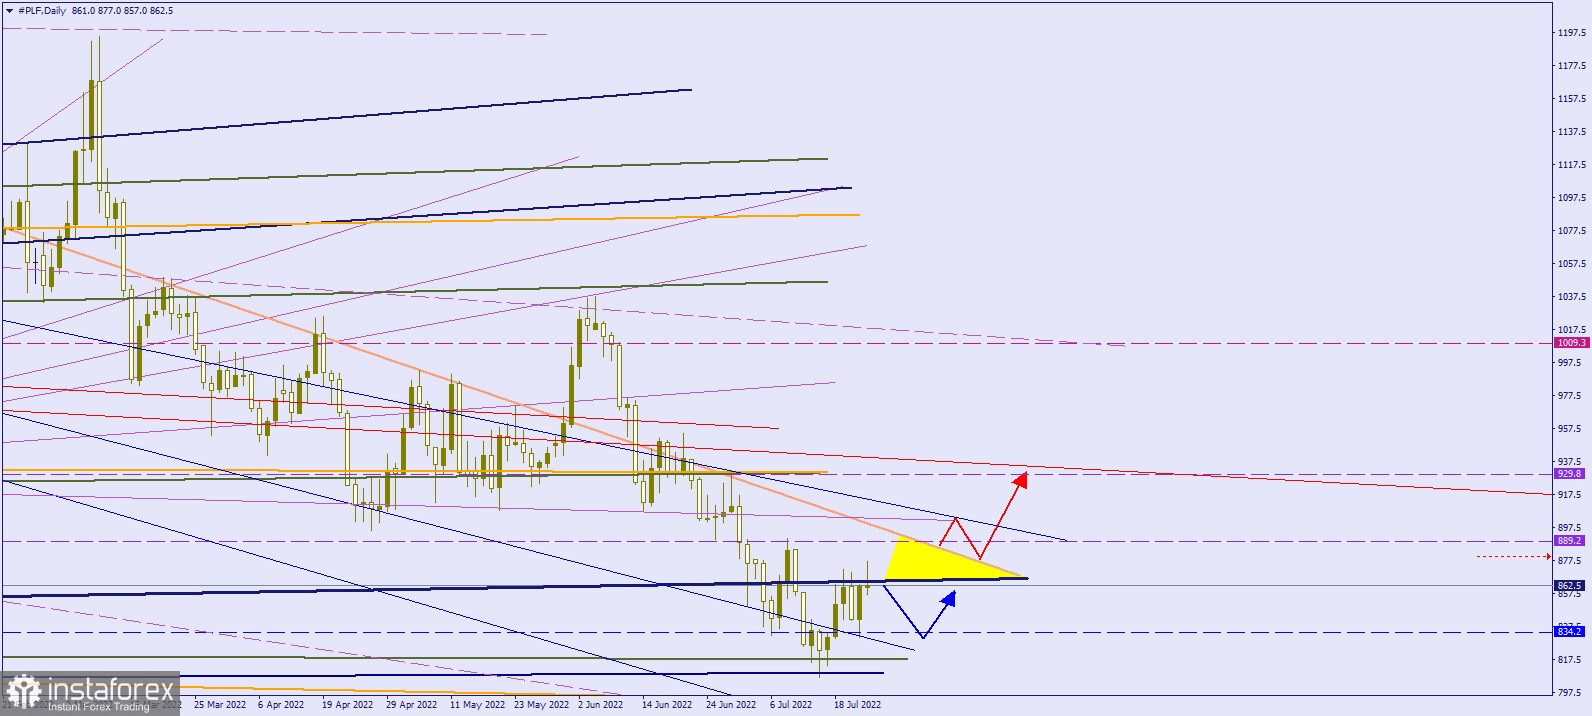
The chart shows the movement of platinum in the daily (D1) chart on July 22, 2022.
Price movement is turbulent. The blue sloping line (highlighted in bold) at $863.0, together with the downward sloping line (beige), forms a divergence, within which (area marked with a yellow triangle) it is very risky to open trading positions.
If the quote does not break through the boundary of the resistance area of $ 863.0, expect a pullback towards $834.0-$817.0.
The breakdown of these boundaries signals the beginning of a new trend.