 English
  Русский
 Bahasa Indonesia
 Bahasa Malay
 ไทย
ไทย Español
 Deutsch
 Български
 Français
 Tiếng Việt
 中文
中文 বাংলা
বাংলা हिन्दी
 Čeština
 Українська
 Română

Dollar (#USD):
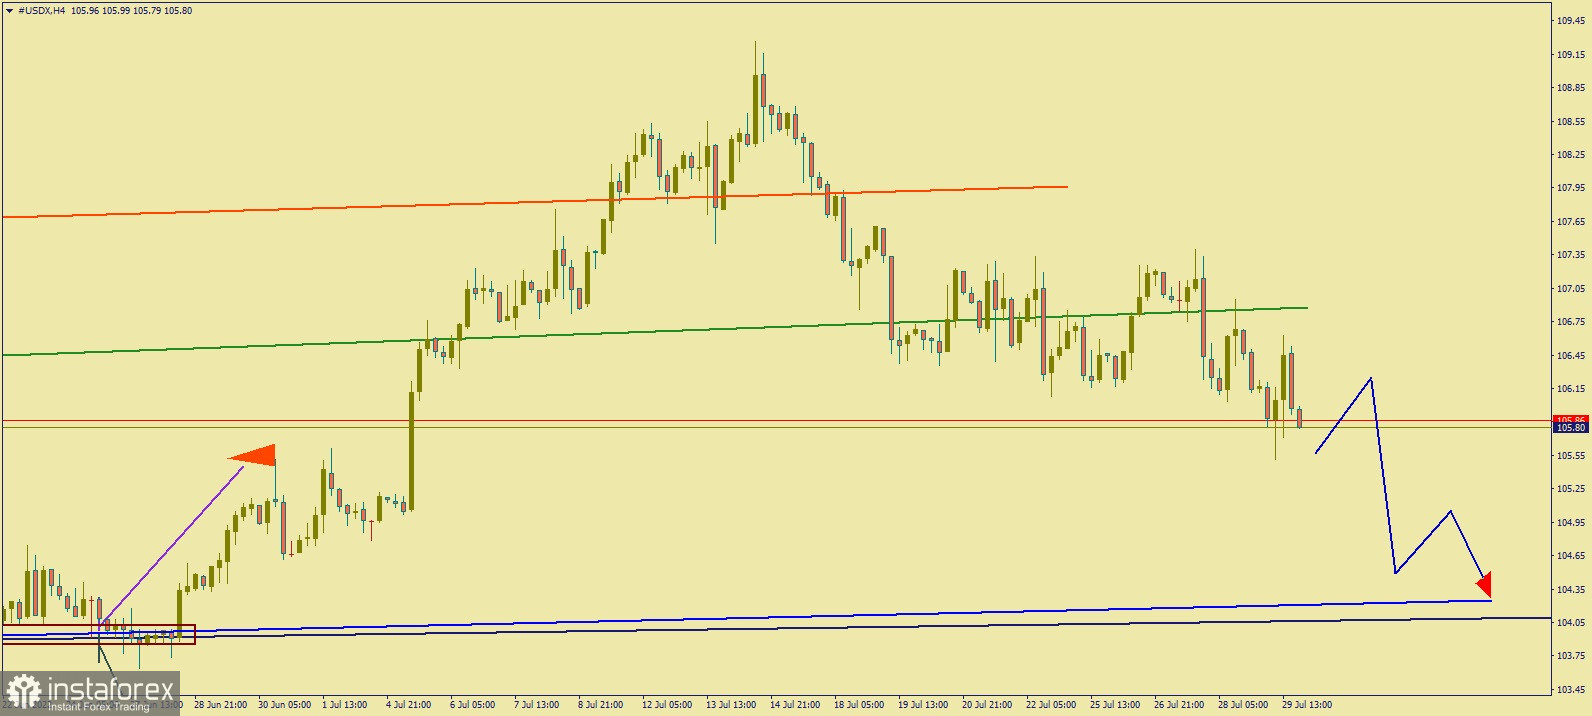
The chart shows the movement of dollar in the four-hour (H4) chart.
Comparing July 29's movement to that of June 3's, it is clear that the USD index is developing a downward trend. Its quotes, over the past 2 weeks, have broken through two important support levels (sloping red and green lines), making 104.25 the new target price level. Most likely, dollar will move in accordance to the picture presented above.