 English
  Русский
 Bahasa Indonesia
 Bahasa Malay
 ไทย
ไทย Español
 Deutsch
 Български
 Français
 Tiếng Việt
 中文
中文 বাংলা
বাংলা हिन्दी
 Čeština
 Українська
 Română

Trend analysis (Fig. 1).
On Tuesday, moving up from 1.2246 (closing of yesterday's daily candlestick), the quote will try to hit the upper fractal at 1.2331 (red dotted line). If the price tests this mark, it may pull back to the 14.6% retracement level of 1.2172 (blue dotted line) and extend the uptrend.
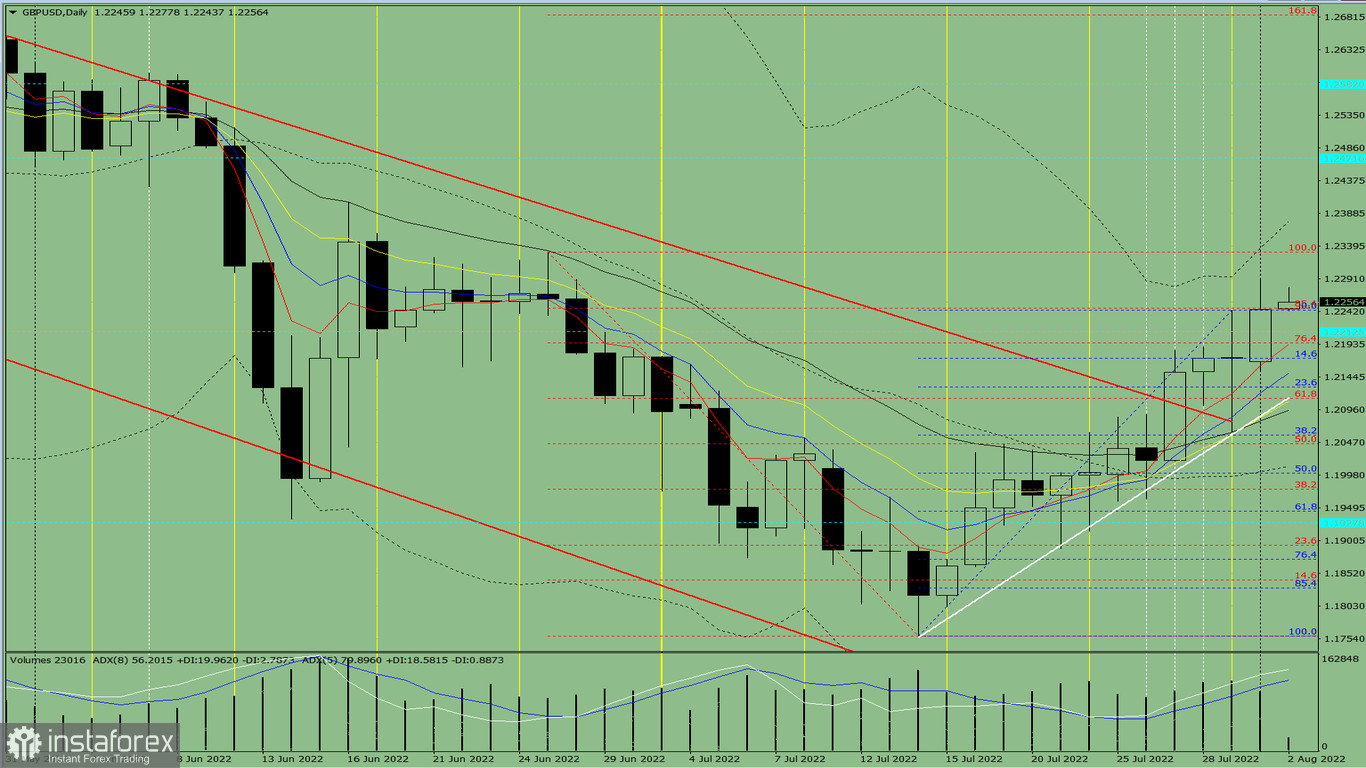
Fig. 1 (daily chart).
Complex analysis:
- indicator analysis - up
- Fibonacci levels - up
- volumes - up
- candlestick analysis - up
- trend analysis - up
- Bollinger bands - up
- weekly chart - up
Final thoughts:
Today, moving up from 1.2246 (closing of yesterday's daily candlestick), the quote will try to hit the upper fractal at 1.2331 (red dotted line). If the price tests this mark, it may pull back to the 14.6% retracement level of 1.2172 (blue dotted line) and extend the uptrend.
Alternative scenario: moving down from 1.2246 (closing of yesterday's daily candlestick), the pair will try to reach 1.0178 historic support (blue dotted line). If the quote tests this level, it may rise to the upper fractal at 1.2331 (red dotted line) and extend growth.