 English
  Русский
 Bahasa Indonesia
 Bahasa Malay
 ไทย
ไทย Español
 Deutsch
 Български
 Français
 Tiếng Việt
 中文
中文 বাংলা
বাংলা हिन्दी
 Čeština
 Українська
 Română

NZD/USD:
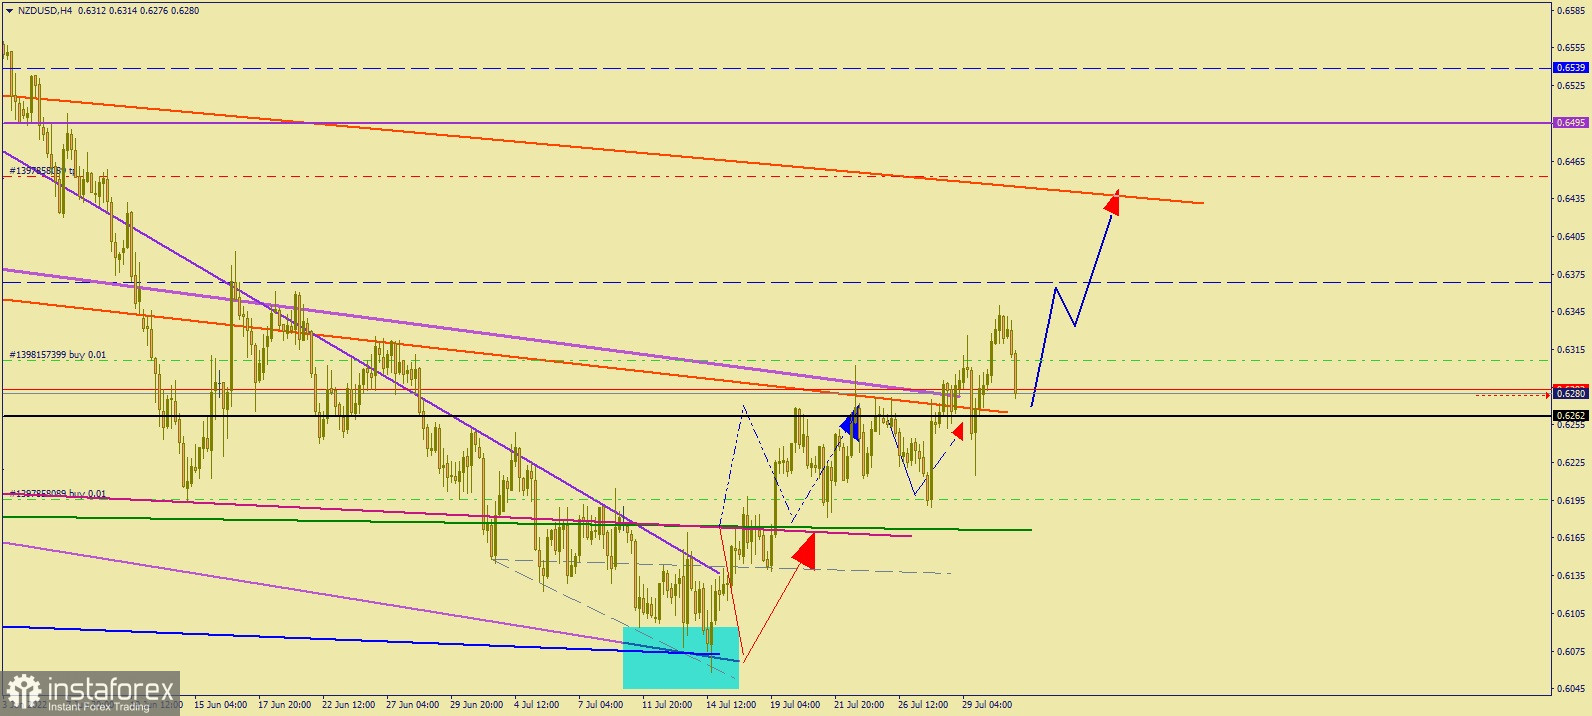
The chart shows the movement of NZD/USD in the four-hour (H4) chart.
Comparing the recent movement to that of June 15 and June 26's, it is clear that the pair broke through the resistance level of 0.6262 last week, turning it into a strong support level. This level will be a key in rising further to 0.6435.
In the event of a breakdown of the current resistance level of 0.6262, quotes will most likely decline to 0.6195.
Good luck!