 English
  Русский
 Bahasa Indonesia
 Bahasa Malay
 ไทย
ไทย Español
 Deutsch
 Български
 Français
 Tiếng Việt
 中文
中文 বাংলা
বাংলা हिन्दी
 Čeština
 Українська
 Română

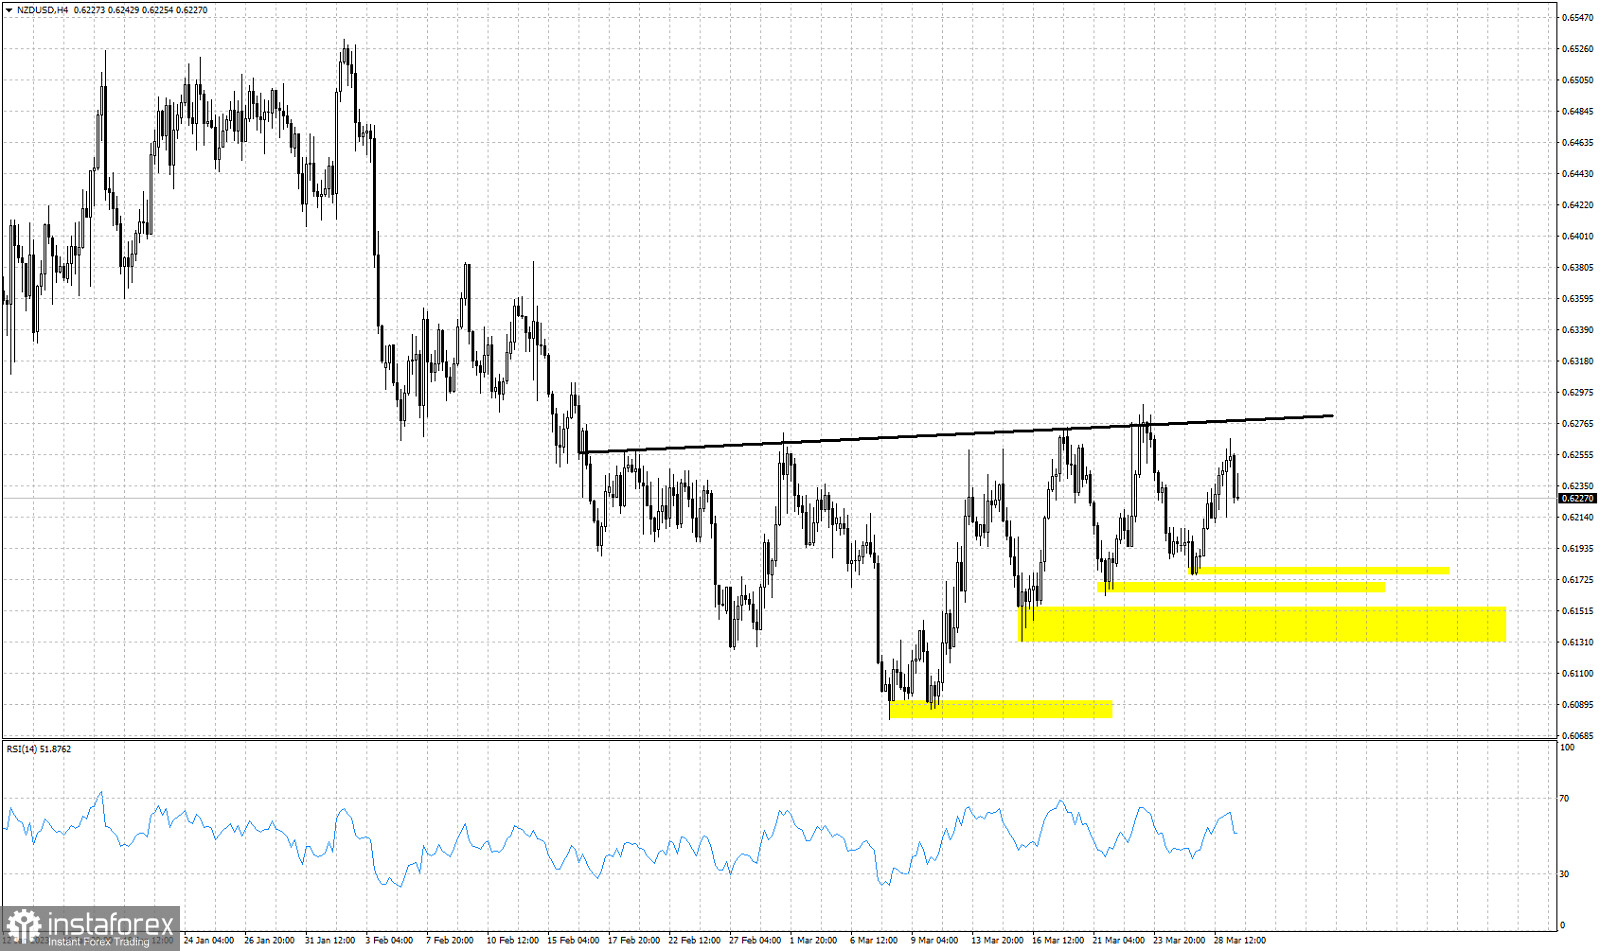
Black line- neckline resistance
Yellow rectangles- higher lows
NZDUSD is trading around 0.6224. Price continues making higher lows but earlier today it formed a lower high. Price thus far is unable to push above the neckline resistance of 0.6275. So far price has gotten rejected several times at this resistance trend line. Today price formed a lower high, which is a sign of weakness. A break below the latest higher low at 0.6175 would be a bearish sign. We continue to be bearish NZDUSD as long as price is below the neckline resistance. A break below 0.6175 will open the way for a move at least towards 0.6085.