 English
  Русский
 Bahasa Indonesia
 Bahasa Malay
 ไทย
ไทย Español
 Deutsch
 Български
 Français
 Tiếng Việt
 中文
中文 বাংলা
বাংলা हिन्दी
 Čeština
 Українська
 Română

Trend analysis (Fig. 1).
On Thursday, the price will attempt to rise from 1.0165 (closing of yesterday's daily candlestick) and test the 38.2% retracement level of 1.0203 (red dotted line). Should the quote reach the mark, the upward target will stand at the 50% retracement level of 1.0281 (red dotted line). If the pair approaches it, a pullback may occur.
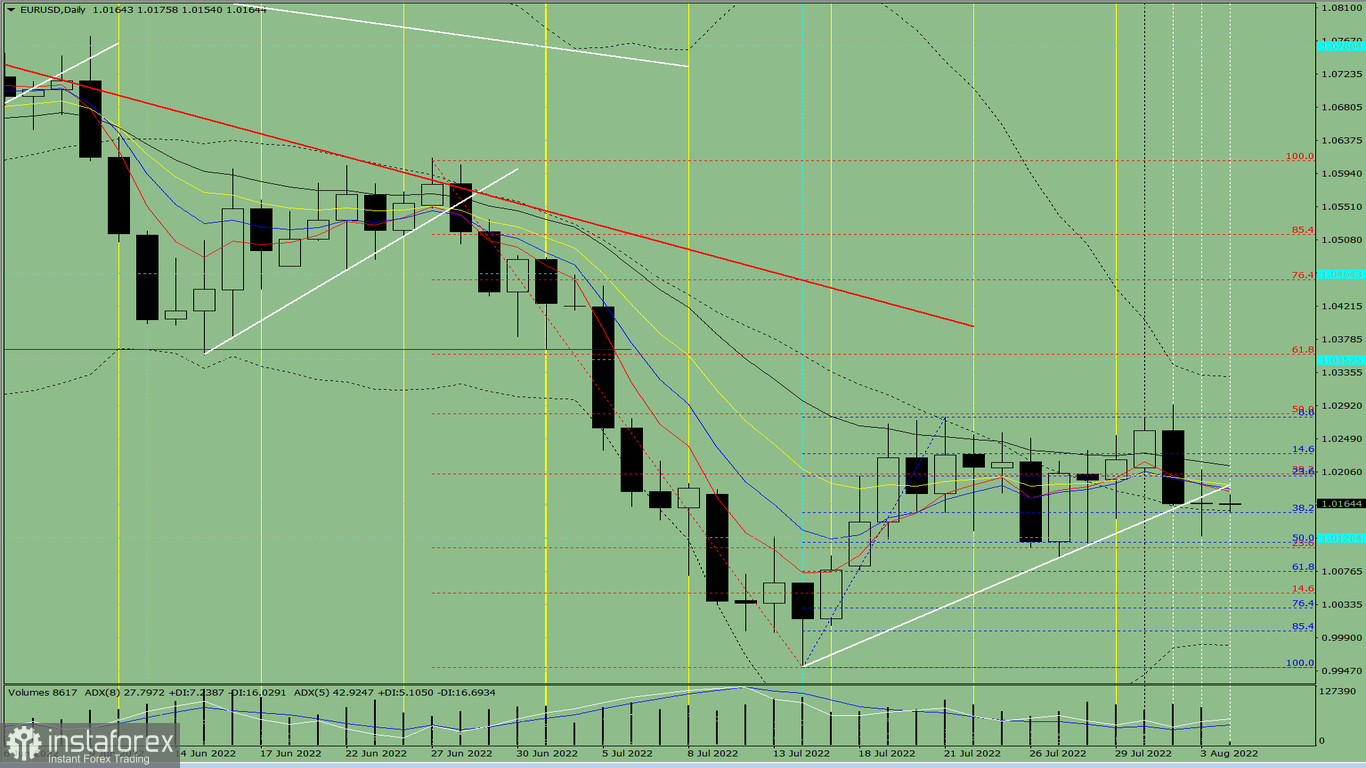
Fig. 1 (daily chart).
Complex analysis:
- indicator analysis - up
- Fibonacci levels - up
- volumes - up
- candlestick analysis - up
- trend analysis - up
- Bollinger bands - down
- weekly chart - up
Final thoughts:
On Thursday, the price will attempt to rise from 1.0165 (closing of yesterday's daily candlestick) and test the 38.2% retracement level of 1.0203 (red dotted line). Should the quote reach the mark, the upward target will stand at the 50% retracement level of 1.0281 (red dotted line). If the pair approaches it, a pullback may occur.
Alternative scenario: the price will attempt to rise from 1.0165 (closing of yesterday's daily candlestick) and test 1.0191 support (white bold line). Should the quote reach the line, the target will stand at the 50% retracement level of 1.0119 (blue dotted line). If the pair approaches it, a rebound may occur.