 English
  Русский
 Bahasa Indonesia
 Bahasa Malay
 ไทย
ไทย Español
 Deutsch
 Български
 Français
 Tiếng Việt
 中文
中文 বাংলা
বাংলা हिन्दी
 Čeština
 Українська
 Română

Trend analysis
GBP/USD will rise this week, starting from the closing of the last weekly candle at 1.2067 to the 23.6% retracement level at 1.2227 (red dotted line). After that it will move to the 38.2% retracement level at 1.2516 (red dotted line), then go downwards.
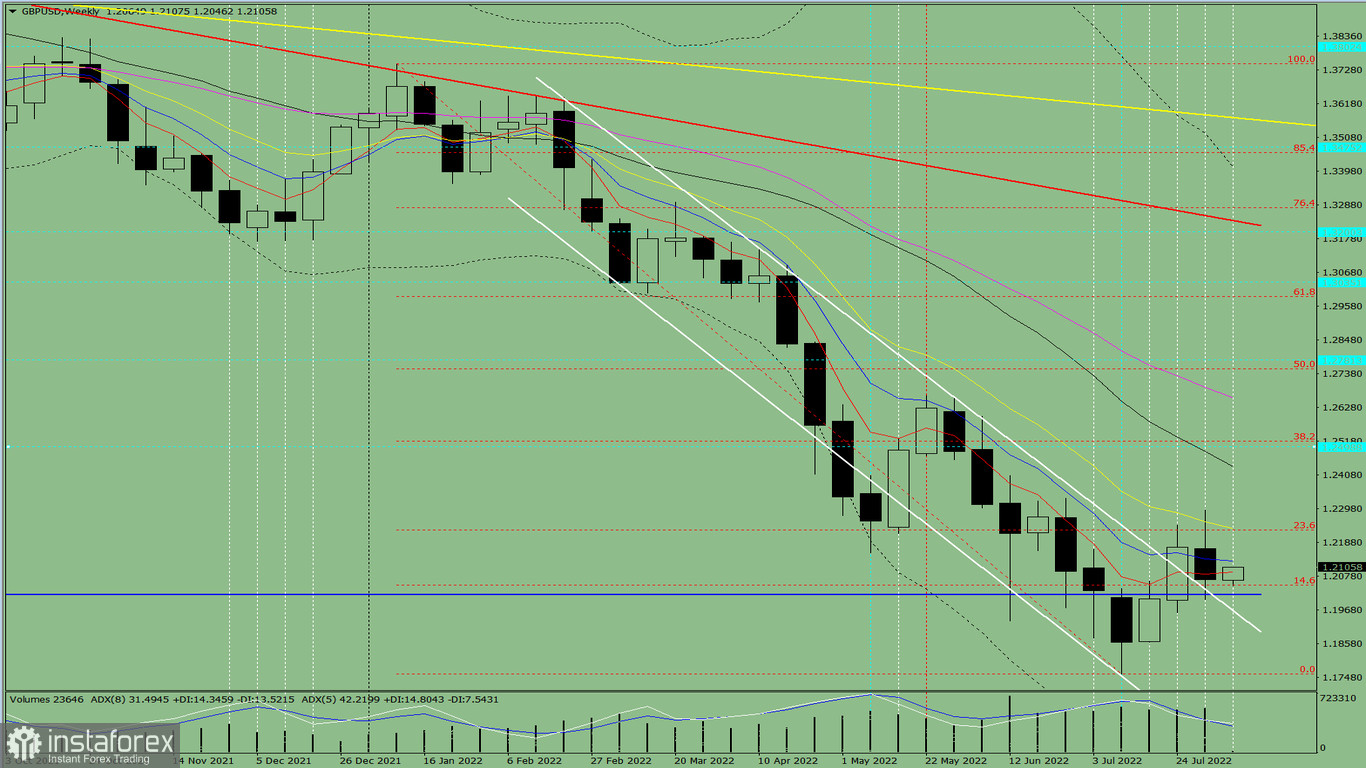
Fig. 1 (weekly chart)
Comprehensive analysis:
Indicator analysis - uptrend
Fibonacci levels - uptrend
Volumes - uptrend
Candlestick analysis - uptrend
Trend analysis - uptrend
Bollinger bands - uptrend
Monthly chart - uptrend
All this points to an upward movement in GBP/USD.
Conclusion: The pair will have an upward trend, with no first lower shadow on the weekly white candle (Monday - up) and no second upper shadow (Friday - up).
During the week, pound will increase from 1.2067 (the closing of the last weekly candle) to 1.2227, which is the 23.6% retracement level (red dotted line). Then, it will go to the 38.2% retracement level at 1.2516 (red dotted line), before moving downwards.
Alternatively, the quote could fall from 1.2067 (closing of the last weekly candle) to the support line at 1.1966 (thick white line), then go to the 14.6% retracement level at 1.2047 (red dotted line) and higher price levels.