 English
  Русский
 Bahasa Indonesia
 Bahasa Malay
 ไทย
ไทย Español
 Deutsch
 Български
 Français
 Tiếng Việt
 中文
中文 বাংলা
বাংলা हिन्दी
 Čeština
 Українська
 Română

Analysis of Monday's deals:
30M chart of the GBP/USD pair
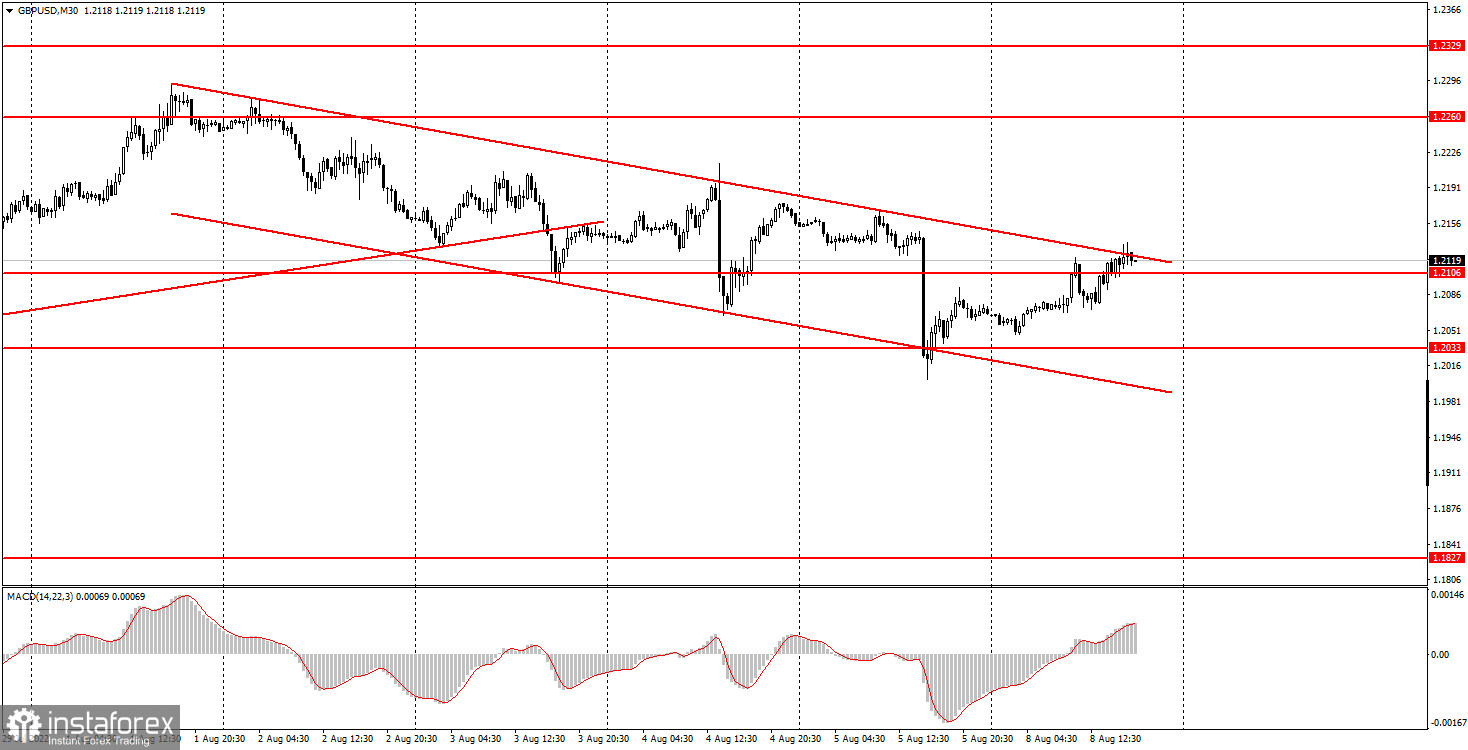
The GBP/USD pair traded almost identically to the EUR/USD pair on Monday. For most of the day, the quotes of the British pound impressively grew and by the evening they were near the upper limit of the downward channel, which is rather narrow. Recall that the euro is located inside a wide horizontal channel at the same time. Obviously, both major currency pairs would like to come to a common denominator and form the same trends. One way or another, the quotes failed to overcome the upper border of the channel, so today or tomorrow we can see a new round of decline. Recall that we believe that the main scenario for the development of events is the further fall of both the euro and the pound. From our point of view, now there are simply not enough factors that could support European currencies. And those factors that did exist have already been worked out by market participants several times. In general, despite the growth on Monday, despite the complete absence of important events on Monday and Tuesday, we believe that the pair will continue its downward movement. The next important event this week will be the US inflation report (Wednesday).
5M chart of the GBP/USD pair
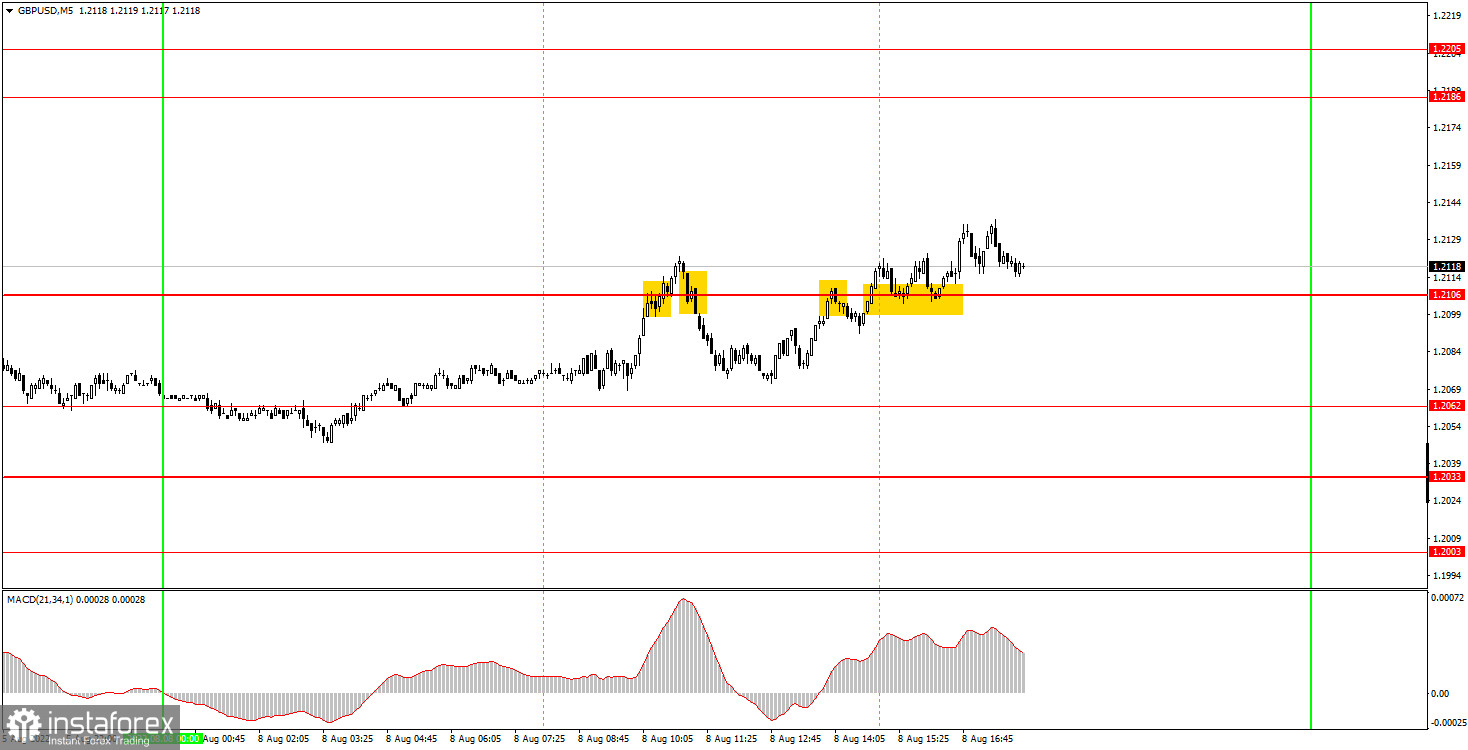
The pound/dollar pair showed exactly the same movements as the euro/dollar on the 5-minute timeframe. However, traders of the pound were less fortunate, as there was one level on the way up, which was worked out five or six times in total. Naturally, most of the trading signals around it turned out to be false. Or rather, everything. Novice traders could try to work out only the first two signals, since all subsequent ones should definitely be filtered out with the first two false ones. So, first the pair settled above the level of 1.2106, and then below it. It was not possible to close a long position even by Stop Loss set to breakeven, as the pair could not move even 20 points in the right direction. I was a little more lucky with a short position, as the pair dropped 26-27 points, so the loss was avoided. As a result, newcomers received a small loss on the first trade, which is not critical, since the volatility was low today, and the movement was not the best. And it can't be profitable every day.
How to trade on Tuesday:
The pound/dollar pair started a new downward trend on the 30-minute TF. It fell on Thursday and Friday due to US statistics and the Bank of England meeting, and it began to correct on Monday, but it failed to exit the downward channel. Thus, a rebound from the upper border may provoke a resumption of decline in the pound. We can't say that macroeconomics this week will have a strong influence on market sentiment, but there will still be several reports, so the pound will have grounds for further decline. On the 5-minute TF on Tuesday, it is recommended to trade at the levels of 1.1967, 1.2033, 1.2062, 1.2106, 1.2186, 1.2205, 1.2245-1.2260. When the price passes after opening a deal in the right direction for 20 points, Stop Loss should be set to breakeven. Again, no major events are scheduled for Tuesday in the US and UK. Thus, traders will again have nothing to react to during the day.
Basic rules of the trading system:
1) The signal strength is calculated by the time it took to form the signal (bounce or overcome the level). The less time it took, the stronger the signal.
2) If two or more deals were opened near a certain level based on false signals (which did not trigger Take Profit or the nearest target level), then all subsequent signals from this level should be ignored.
3) In a flat, any pair can form a lot of false signals or not form them at all. But in any case, at the first signs of a flat, it is better to stop trading.
4) Trade deals are opened in the time period between the beginning of the European session and until the middle of the US one, when all deals must be closed manually.
5) On the 30-minute TF, using signals from the MACD indicator, you can trade only if there is good volatility and a trend, which is confirmed by a trend line or a trend channel.
6) If two levels are located too close to each other (from 5 to 15 points), then they should be considered as an area of support or resistance.
On the chart:
Support and Resistance Levels are the Levels that serve as targets when buying or selling the pair. You can place Take Profit near these levels.
Red lines are the channels or trend lines that display the current trend and show in which direction it is better to trade now.
The MACD indicator (14,22,3) consists of a histogram and a signal line. When they cross, this is a signal to enter the market. It is recommended to use this indicator in combination with trend lines (channels and trend lines).
Important speeches and reports (always contained in the news calendar) can greatly influence the movement of a currency pair. Therefore, during their exit, it is recommended to trade as carefully as possible or exit the market in order to avoid a sharp price reversal against the previous movement.
Beginners on Forex should remember that not every single trade has to be profitable. The development of a clear strategy and money management are the key to success in trading over a long period of time.