 English
  Русский
 Bahasa Indonesia
 Bahasa Malay
 ไทย
ไทย Español
 Deutsch
 Български
 Français
 Tiếng Việt
 中文
中文 বাংলা
বাংলা हिन्दी
 Čeština
 Українська
 Română

Analysis of Tuesday's deals:
30M chart of the EUR/USD pair
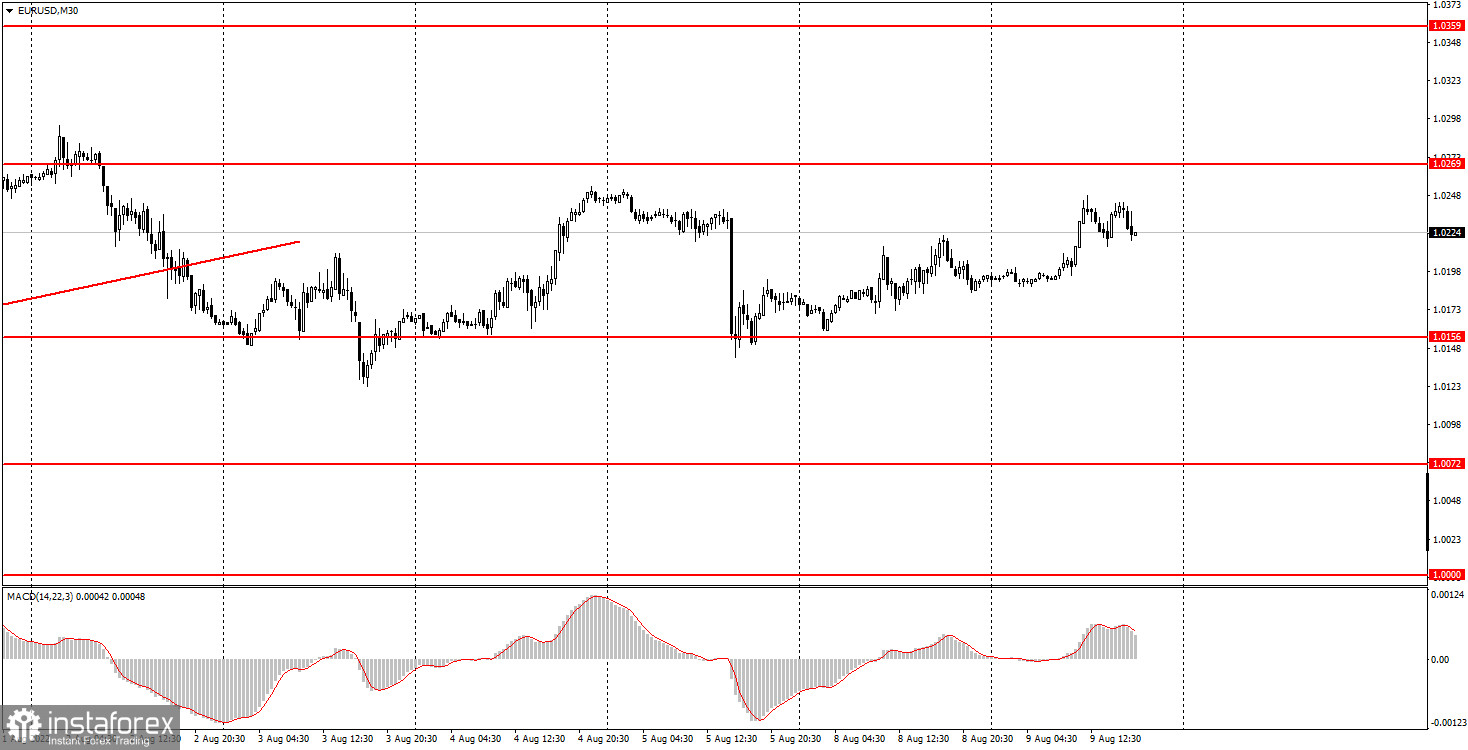
The EUR/USD currency pair continued its slow upward movement on Tuesday after rebounding from the level of 1.0156 last Friday. Recall that the pair has been moving strictly inside the horizontal channel for a month already, the approximate boundaries of which are 1.0120 and 1.0280. It is not very noticeable on the lower timeframes, but on the higher ones (4-hours, for example), it is perfectly visible and does not need additional explanations. Thus, everything that happens at the beginning of a new week is a simple, banal movement from one horizontal channel border to another. There were no important macroeconomic statistics either in America or in the European Union. There was not even just important news or events. The volatility of the euro is slowly starting to decline and for the second day in a row it does not exceed 60 points. As a result, we have not only a flat, since the volatility is also weak. Should I tell novice traders that these are the most unattractive conditions for trading?
5M chart of the EUR/USD pair
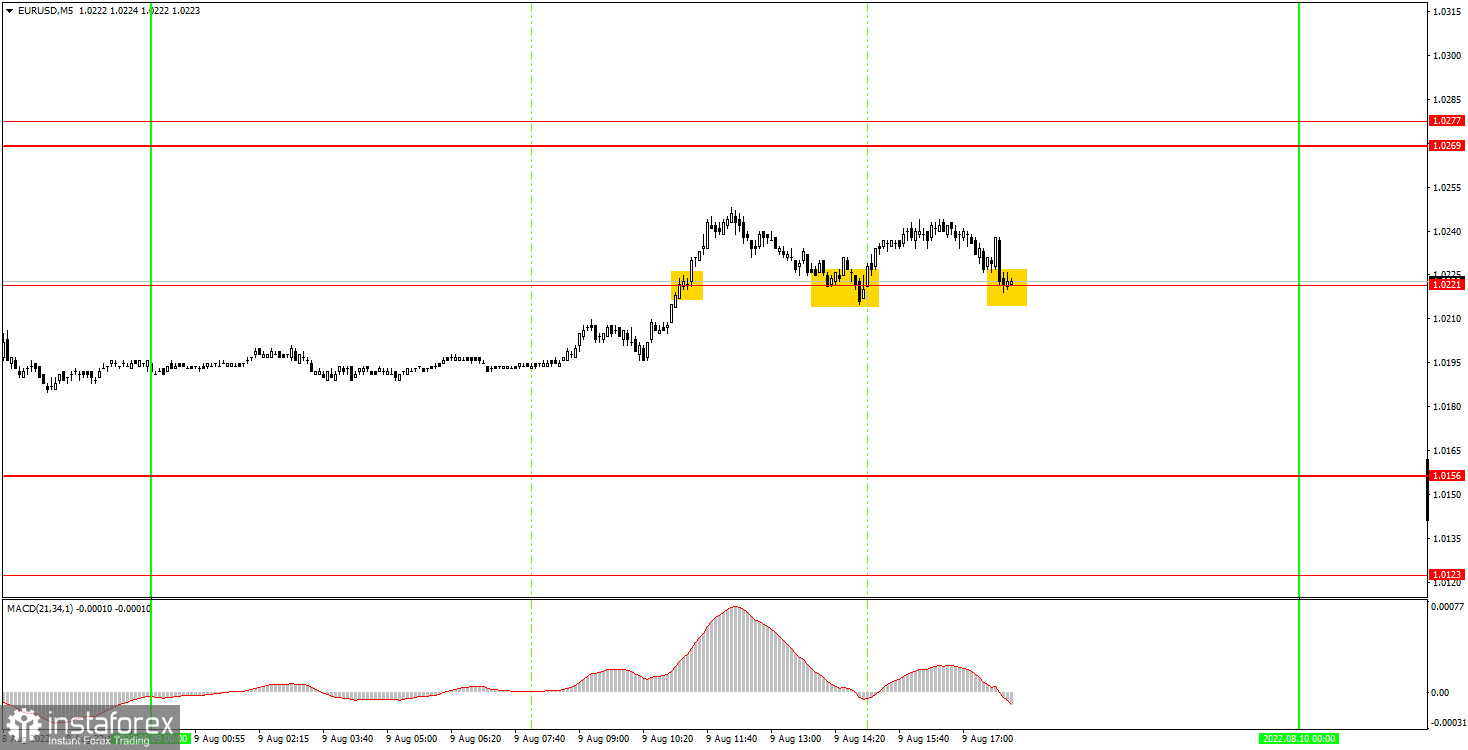
It is perfectly clear on the 5-minute timeframe that the pair tried to move during the day, but what looks solid on the 5-minute timeframe looks like a regular flat on the 4-hour timeframe for a month already. As a result, novice traders were very lucky today that there were practically no blatantly false trading signals. To be more precise, the pair has formed three trading signals, and all three are near the level of 1.0221, that is, approximately in the middle of the horizontal channel. The last signal definitely should not have been worked out, since it was formed too late. The first signal to buy and the second (also to buy) could be worked out, and the pair went up at least 15 points each time, which allowed beginners to set Stop Loss to breakeven on long positions. But, of course, it was not possible to get profits in such conditions. The pair never even tried to get close to the nearest target level of 1.0269. As a result, the day ended for the players in zero profit, which is not so bad, given the nature of the pair's movement.
How to trade on Wednesday:
There is currently a sideways movement between the levels of 1.0120 and 1.0280 on the 30-minute timeframe. Thus, building any trading strategy should be based on the understanding of this fact. The price can still be between these levels for a long time, and it does not necessarily need a strong "macroeconomic" to complete the flat. We believe that it will end as unexpectedly as possible for everyone. It is recommended to trade at the levels of 1.0072, 1.0123, 1.0156, 1.0221, 1.0269-1.0277, 1.0354 on the 5-minute TF on Wednesday. When passing 15 points in the right direction, you should set Stop Loss to breakeven. No major events or reports scheduled for Wednesday in the European Union. However, at least the most important inflation report for July will be published in the US, which, no doubt, will provoke a market reaction. We believe that the reaction may be strong, but it is unlikely that the pair will leave the horizontal channel.
Basic rules of the trading system:
1) The signal strength is calculated by the time it took to form the signal (bounce or overcome the level). The less time it took, the stronger the signal.
2) If two or more deals were opened near a certain level based on false signals (which did not trigger Take Profit or the nearest target level), then all subsequent signals from this level should be ignored.
3) In a flat, any pair can form a lot of false signals or not form them at all. But in any case, at the first signs of a flat, it is better to stop trading.
4) Trade deals are opened in the time period between the beginning of the European session and until the middle of the US one, when all deals must be closed manually.
5) On the 30-minute TF, using signals from the MACD indicator, you can trade only if there is good volatility and a trend, which is confirmed by a trend line or a trend channel.
6) If two levels are located too close to each other (from 5 to 15 points), then they should be considered as an area of support or resistance.
On the chart:
Support and Resistance Levels are the Levels that serve as targets when buying or selling the pair. You can place Take Profit near these levels.
Red lines are the channels or trend lines that display the current trend and show in which direction it is better to trade now.
The MACD indicator (14,22,3) consists of a histogram and a signal line. When they cross, this is a signal to enter the market. It is recommended to use this indicator in combination with trend lines (channels and trend lines).
Important speeches and reports (always contained in the news calendar) can greatly influence the movement of a currency pair. Therefore, during their exit, it is recommended to trade as carefully as possible or exit the market in order to avoid a sharp price reversal against the previous movement.
Beginners on Forex should remember that not every single trade has to be profitable. The development of a clear strategy and money management are the key to success in trading over a long period of time.