 English
  Русский
 Bahasa Indonesia
 Bahasa Malay
 ไทย
ไทย Español
 Deutsch
 Български
 Français
 Tiếng Việt
 中文
中文 বাংলা
বাংলা हिन्दी
 Čeština
 Українська
 Română

Analysis of Tuesday's deals:
30M chart of the GBP/USD pair
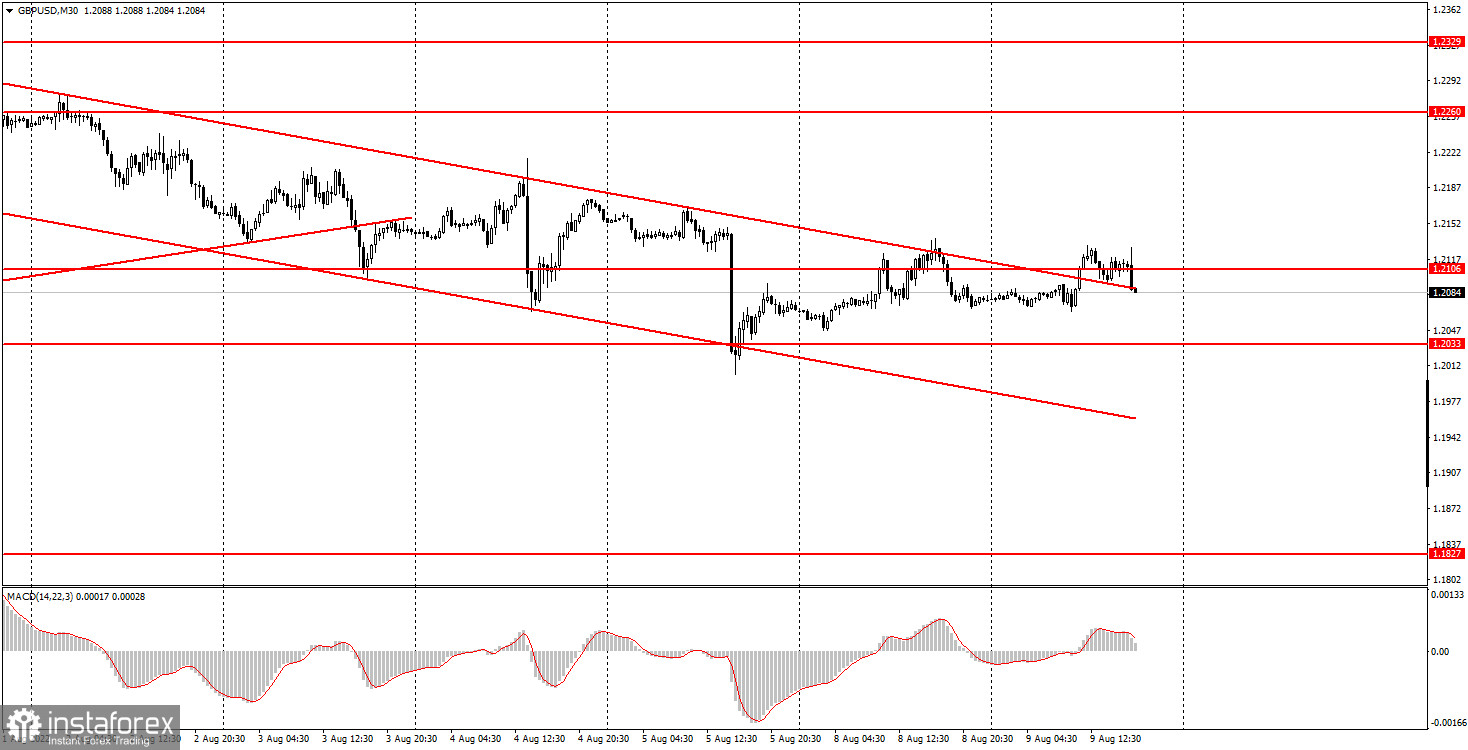
The GBP/USD pair continued to show absolutely strange movements that do not fit into any of the existing technical pictures. Let's start with the fact that the pair has been trading inside a descending channel until today, which was formed over several days. Consolidating above it should have provoked a significant increase in the British currency, but half an hour after it, the quotes fell below the level of 1.2106 and are now trying to resume the downward movement. Volatility at the same time amounted to about 60 points today, that is, it is very low. Also note that the pound/dollar pair is actually trading sideways on Monday and Tuesday. In total, we have a monthly flat for the euro, and a two-day flat for the pound, but it doesn't get any easier for anyone to understand this, since trading in any flat is always extremely inconvenient. And the fall in volatility for both currency pairs only complicates the work of traders. Is it worth saying that today there was nothing interesting either in the UK or in the US, or is it obvious?
5M chart of the GBP/USD pair
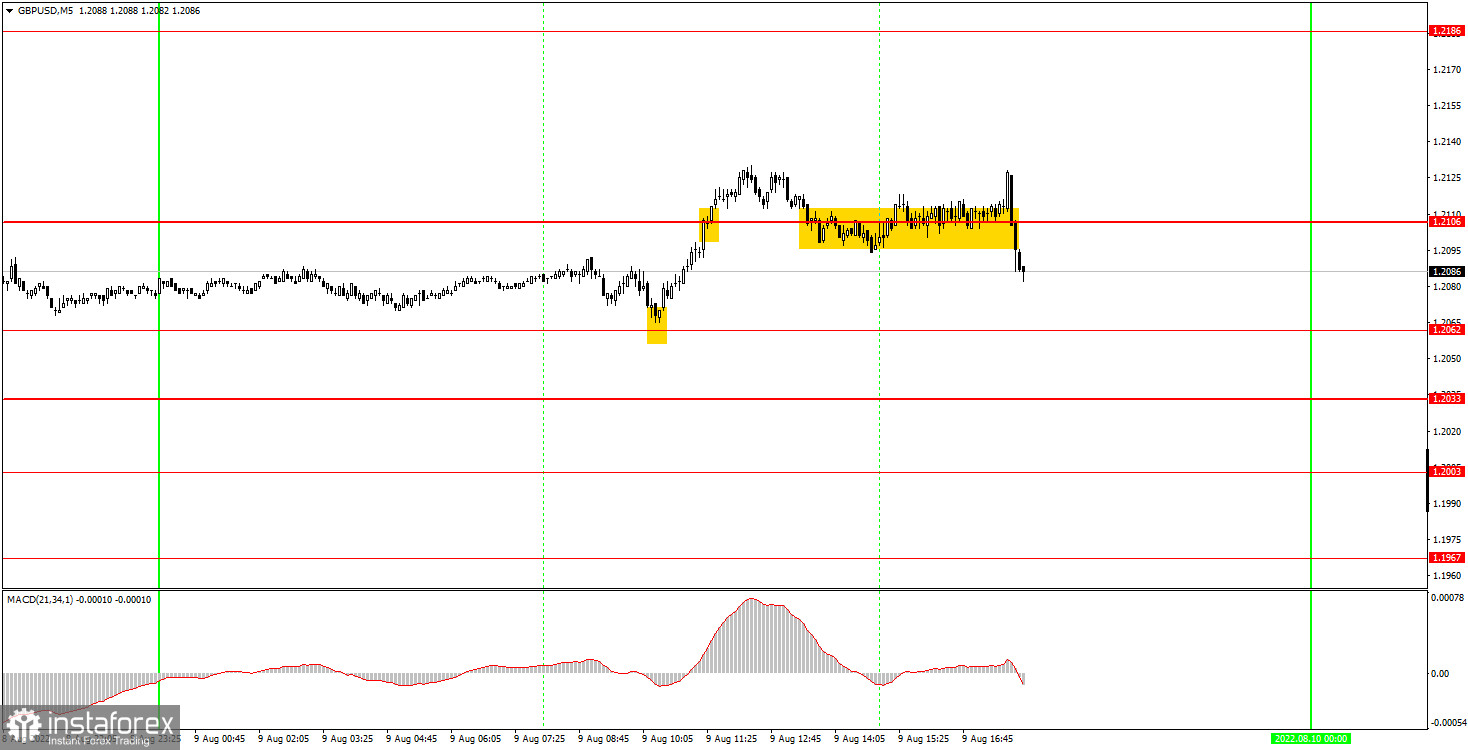
On the 5-minute timeframe, the pound/dollar pair was still trying to trade in a trendy and volatile manner during the European trading session, but on the US one, in general, it simply "fell into a coma" for some time. Then, however, followed by a downward spurt, which looks good in the chart above, but in fact this movement is only 45 points. One way or another, we are interested in trading signals. The first with an error of three points formed near the level of 1.2062. After its formation, the price went up as much as 50 points and even managed to overcome the level of 1.2106. However, in a few hours the price already settled below the level of 1.2106, so the long position had to be closed manually with a profit of about 20 points. The most interesting thing is that a clear and accurate sell signal was not formed. The pair moved along the level of 1.2106 with low volatility for several hours in a row, then it began to grow sharply, and after 5 minutes it fell by 45 points. Therefore, the ideal solution would be not to work out these somersaults, but we assume that beginners could open another trade, which, most likely, was unsuccessful and brought a loss. So the day probably also ended in zero profit.
How to trade on Wednesday:
The pound/dollar pair started a new downward trend on the 30-minute TF. I started and today I could finish it. However, no conclusions can be drawn from the movements of Monday and Tuesday, and we do not recommend trying to take them into account at all in the overall technical picture. It should be understood that these are low-volatility flat movements that cannot be "attached" to anything. No matter how sad it is to hear, but now we have to wait. Wait for the market to "wake up", wait for the US inflation report. Or trade at your own risk, since the conditions for trading are now absolutely unattractive. On the 5-minute TF on Wednesday, it is recommended to trade at the levels of 1.1967, 1.2033, 1.2062, 1.2106, 1.2186, 1.2205, 1.2245-1.2260. When the price passes after opening a deal in the right direction for 20 points, Stop Loss should be set to breakeven. Again, no major events are scheduled for Tuesday in the UK, but the US inflation report for July will be released. This report is the only hope of traders on Wednesday.
Basic rules of the trading system:
1) The signal strength is calculated by the time it took to form the signal (bounce or overcome the level). The less time it took, the stronger the signal.
2) If two or more deals were opened near a certain level based on false signals (which did not trigger Take Profit or the nearest target level), then all subsequent signals from this level should be ignored.
3) In a flat, any pair can form a lot of false signals or not form them at all. But in any case, at the first signs of a flat, it is better to stop trading.
4) Trade deals are opened in the time period between the beginning of the European session and until the middle of the US one, when all deals must be closed manually.
5) On the 30-minute TF, using signals from the MACD indicator, you can trade only if there is good volatility and a trend, which is confirmed by a trend line or a trend channel.
6) If two levels are located too close to each other (from 5 to 15 points), then they should be considered as an area of support or resistance.
On the chart:
Support and Resistance Levels are the Levels that serve as targets when buying or selling the pair. You can place Take Profit near these levels.
Red lines are the channels or trend lines that display the current trend and show in which direction it is better to trade now.
The MACD indicator (14,22,3) consists of a histogram and a signal line. When they cross, this is a signal to enter the market. It is recommended to use this indicator in combination with trend lines (channels and trend lines).
Important speeches and reports (always contained in the news calendar) can greatly influence the movement of a currency pair. Therefore, during their exit, it is recommended to trade as carefully as possible or exit the market in order to avoid a sharp price reversal against the previous movement.
Beginners on Forex should remember that not every single trade has to be profitable. The development of a clear strategy and money management are the key to success in trading over a long period of time.