 English
  Русский
 Bahasa Indonesia
 Bahasa Malay
 ไทย
ไทย Español
 Deutsch
 Български
 Français
 Tiếng Việt
 中文
中文 বাংলা
বাংলা हिन्दी
 Čeština
 Українська
 Română

Analysis of Wednesday's deals:
30M chart of the EUR/USD pair
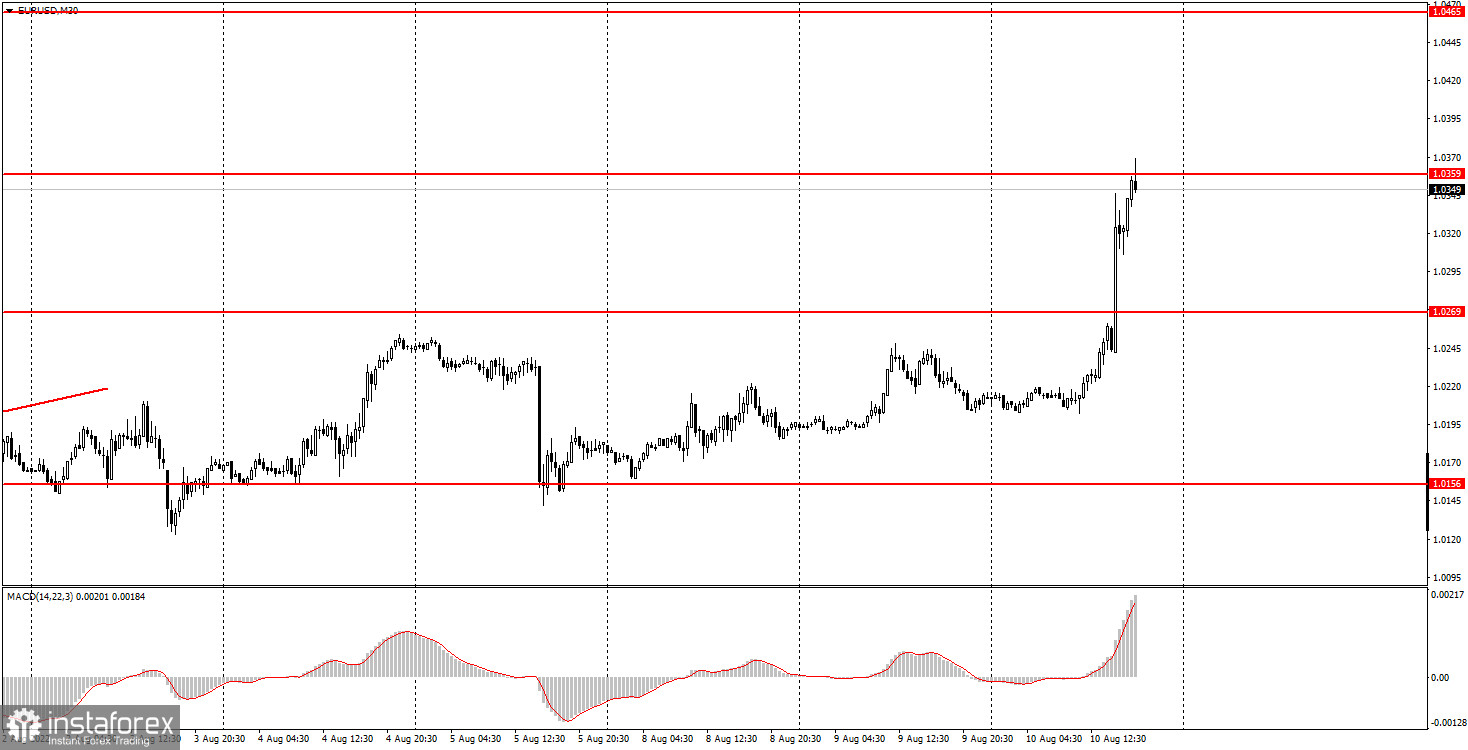
The EUR/USD currency pair rose by 160 points on Wednesday. To be more precise, it rose by 160 points within 2-3 hours after the inflation report for July was published in America. Oddly enough, but the market's reaction was very strong, even stronger than at the Federal Reserve meeting a couple of weeks ago. However, we have what we have. Naturally, since the inflation report caused such a resonance in the market, it is necessary to dwell on it in more detail. The consumer price index amounted to 8.5% in July, which is 0.6% lower than in June. This reduction in inflation can be called "substantial", which is what the Fed wanted to achieve with its actions. Thus, the value of 8.5% means that the likelihood of further aggressive tightening of the Fed's monetary policy is sharply reduced. This does not mean that now the Fed will raise the rate by 0.25% every next meeting, but the fact that its ardor will cool down is absolutely certain. Well, for the US dollar, this news does not contribute to a new strengthening. Despite the fact that the Fed will still continue to raise the rate, the market regarded the inflation report almost as a complete rejection of the Fed's new tightening of monetary policy. We believe that the dollar may still show growth this year, but the way the market reacted on Wednesday suggests a possible change in sentiment in the long term.
5M chart of the EUR/USD pair
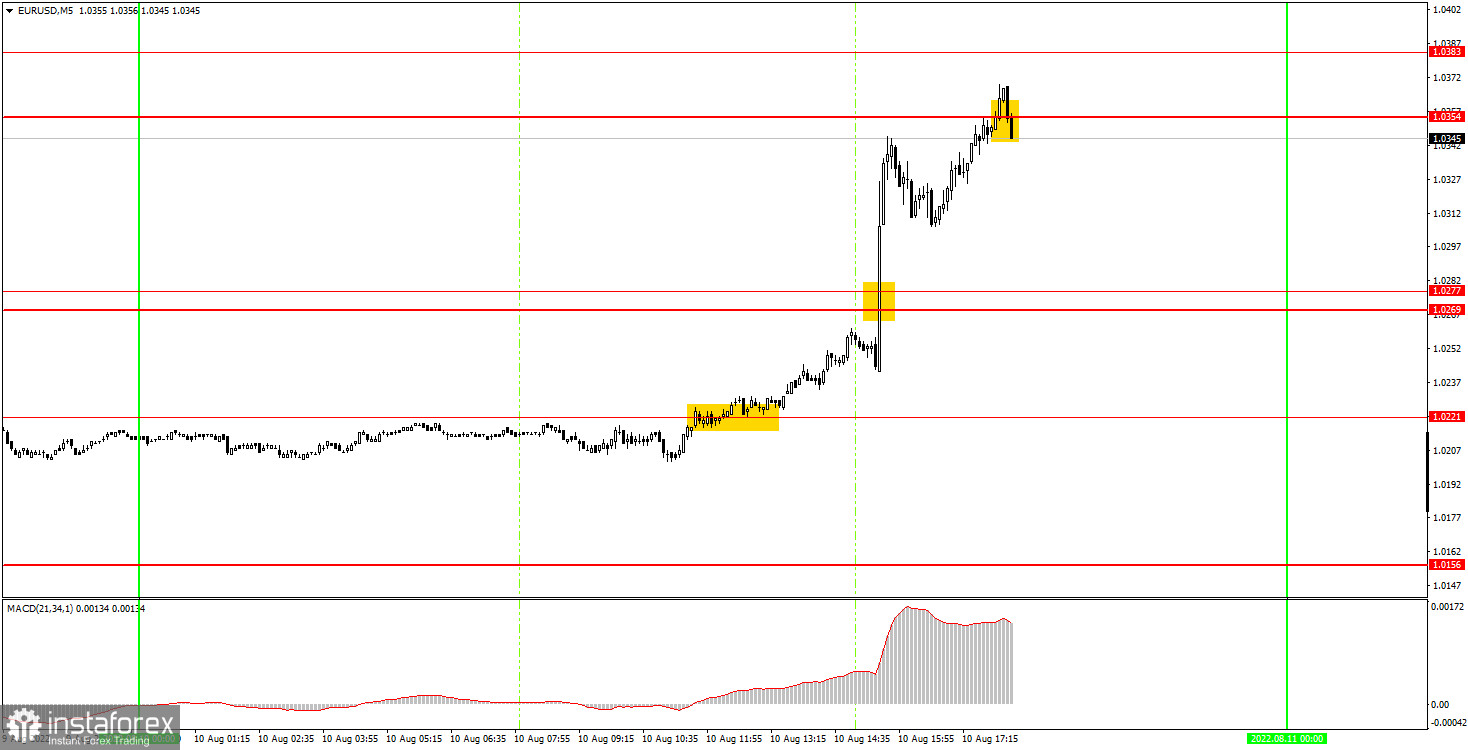
The "flight" of the pair is clearly visible on the 5-minute timeframe. Today there were even a few revealing moments that should be analyzed. We always say that before important reports or events, it is better for novice traders to close all transactions and leave the market. However, today the situation was different. The first buy signal was formed near the level of 1.0221. The price went up 30 points at the opening of the US trading session, that is, on this transaction it was already possible to set Stop Loss to breakeven. Therefore, just before the release of the inflation report, it was possible not to exit a long position, since it was still impossible to get a loss on this transaction. As a result, the pair continued to rise and ended only near the level of 1.0354, which was reached in the late afternoon. Therefore, it was necessary to close long positions here, by at least 114 points in profit. The first two trading days of the week were not the most prosperous, but Wednesday made it possible for the newbies to win back their losses with a vengeance.
How to trade on Thursday:
The price finally left the horizontal channel on the 30-minute timeframe. It is very difficult to say how long the euro's new growth will continue now. Despite the very zealous and eloquent reaction of the market, there are still very few factors in favor of the euro. There is no upward trend line or channel right now either. The price needs to overcome the level of 1.0359 in order to be able to continue rising. On the 5-minute TF on Thursday, it is recommended to trade at the levels of 1.0221, 1.0269-1.0277, 1.0354, 1.0383, 1.0433, 1.0465. When passing 15 points in the right direction, you should set Stop Loss to breakeven. No important events or publications scheduled again in the European Union on Thursday. Only a completely minor report on jobless claims will be published in the US. It will just be an opportunity to see if the bulls are ready for further pressure.
Basic rules of the trading system:
1) The signal strength is calculated by the time it took to form the signal (bounce or overcome the level). The less time it took, the stronger the signal.
2) If two or more deals were opened near a certain level based on false signals (which did not trigger Take Profit or the nearest target level), then all subsequent signals from this level should be ignored.
3) In a flat, any pair can form a lot of false signals or not form them at all. But in any case, at the first signs of a flat, it is better to stop trading.
4) Trade deals are opened in the time period between the beginning of the European session and until the middle of the US one, when all deals must be closed manually.
5) On the 30-minute TF, using signals from the MACD indicator, you can trade only if there is good volatility and a trend, which is confirmed by a trend line or a trend channel.
6) If two levels are located too close to each other (from 5 to 15 points), then they should be considered as an area of support or resistance.
On the chart:
Support and Resistance Levels are the Levels that serve as targets when buying or selling the pair. You can place Take Profit near these levels.
Red lines are the channels or trend lines that display the current trend and show in which direction it is better to trade now.
The MACD indicator (14,22,3) consists of a histogram and a signal line. When they cross, this is a signal to enter the market. It is recommended to use this indicator in combination with trend lines (channels and trend lines).
Important speeches and reports (always contained in the news calendar) can greatly influence the movement of a currency pair. Therefore, during their exit, it is recommended to trade as carefully as possible or exit the market in order to avoid a sharp price reversal against the previous movement.
Beginners on Forex should remember that not every single trade has to be profitable. The development of a clear strategy and money management are the key to success in trading over a long period of time.