 English
  Русский
 Bahasa Indonesia
 Bahasa Malay
 ไทย
ไทย Español
 Deutsch
 Български
 Français
 Tiếng Việt
 中文
中文 বাংলা
বাংলা हिन्दी
 Čeština
 Українська
 Română

Analysis of Wednesday's deals:
30M chart of the GBP/USD pair
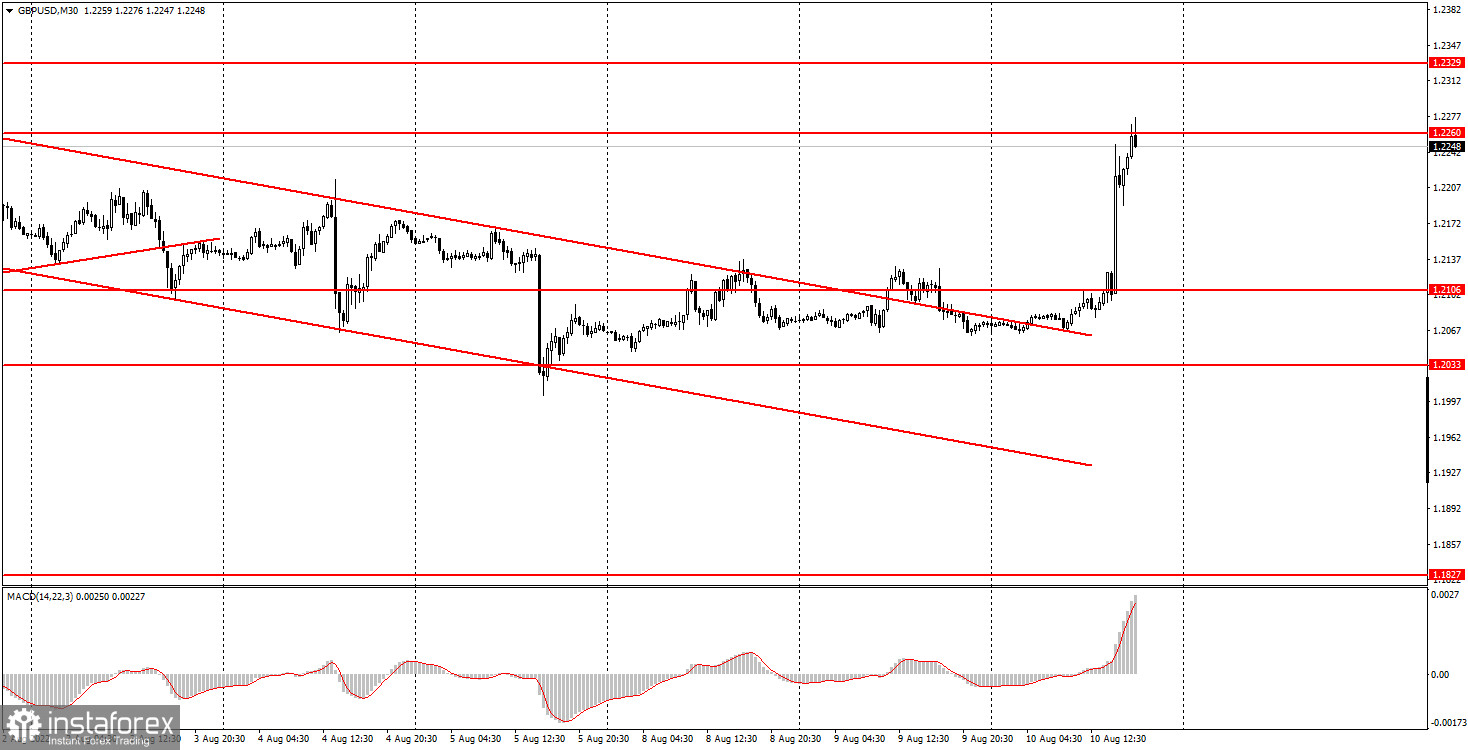
The GBP/USD pair, after leaving the descending channel a day earlier, showed an impressive growth today. However, we all understand what caused this growth. If there was no US inflation report on Wednesday, then there is a 90% probability that the pound's growth would not have happened either. However, there was a report, so we have to put up with the pound's growth by 200 points during the day. In principle, if the Bank of England raised the rate by 1.00% at once, the British currency would probably rise less. But these are the realities of the foreign exchange market at the beginning of the second half of 2022 - the US inflation report is more important than the Federal Reserve meeting and the Nonfarm report. One way or another, but at this time we can say that the pound resumed its upward trend. It failed to overcome the level of 1.2206, above which the last local high is located, so the pound's succeeding growth is also far from obvious. In general, reports such as today's are great to confuse all the cards for traders. Now, probably, everyone assumes that the euro and the pound will continue to grow in the medium term. But we, although we also tend to this option, urge not to treat it as the only one and 100% correct. The pound has yet to see Friday's GDP report...
5M chart of the GBP/USD pair
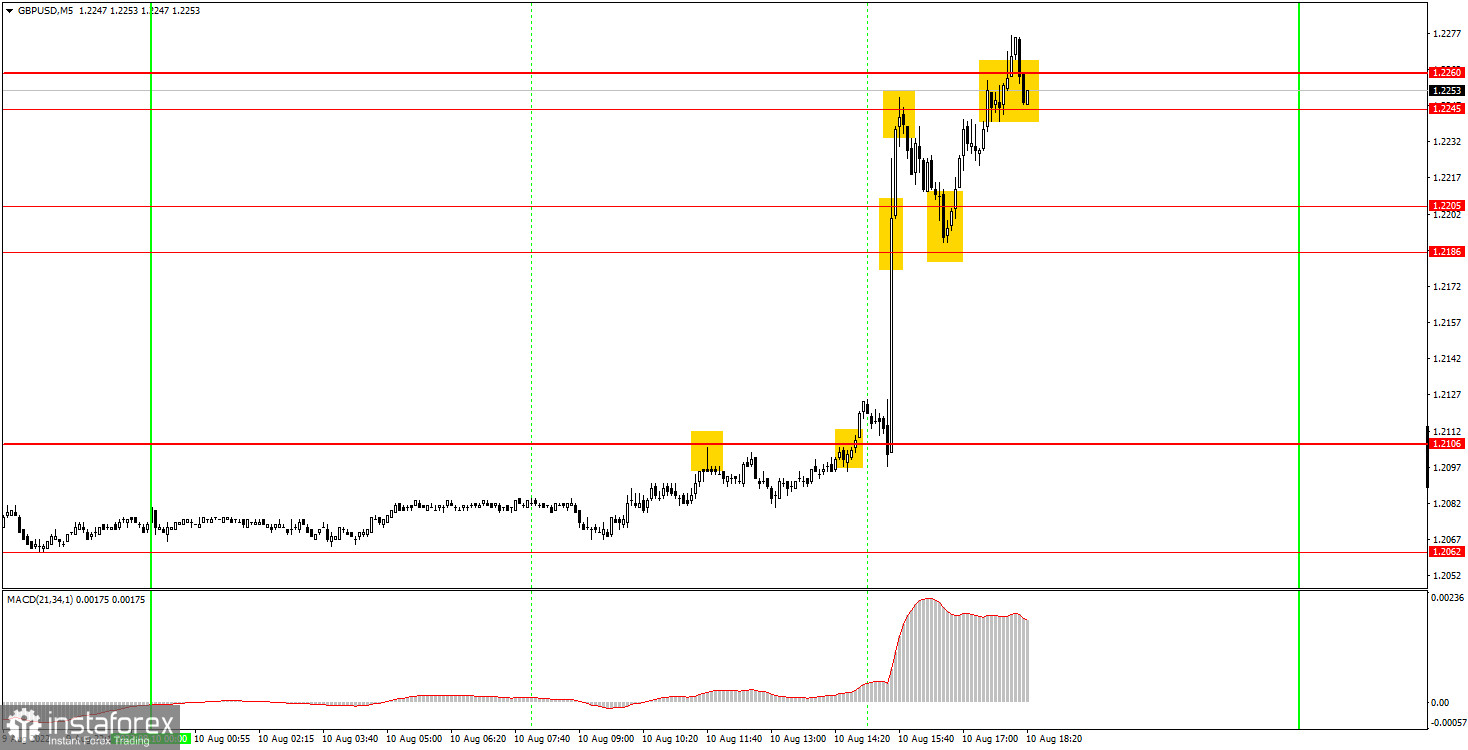
On the 5-minute timeframe, the pound/dollar pair continued to trade in the European trading session, as if it was at a wake. Naturally, we observed a "take-off" at the US trading session. However, the situation for the pound is completely different from the situation for the euro, which made it possible for newcomers to earn more than 100 points. Let's start with the fact that a sell signal was formed near the level of 1.2106 in the European session. After its formation, the price failed to go down 20 points, so Stop Loss could not be set to breakeven. The next buy signal was formed half an hour before the release of the inflation report. Therefore, it should not have been worked out, as it was too risky. As we already know, then a strong upward movement began and several more trading signals were formed, but we believe that they should also be ignored, because a very strong movement began and traders simply would not have had time to work out many of them. And buying the pair after it went up 200 points was at least risky.
How to trade on Thursday:
The pound/dollar pair skyrocketed to the 1.2260 level on the 30-minute time frame, but now it needs to break this level to confirm its intentions to form a new upward trend. It is easy to show a strong movement on one report, but is the market ready to continue buying the pound? Especially when the likely weak UK GDP report comes out on Friday? On the 5-minute TF on Thursday, it is recommended to trade at the levels of 1.2106, 1.2186, 1.2205, 1.2245-1.2260, 1.2329-1.2337. When the price passes after opening a deal in the right direction for 20 points, Stop Loss should be set to breakeven. The calendar of events is still empty in the UK on Thursday, and only a couple of minor reports will be released in the US, which are unlikely to be reflected in the chart of the pound/dollar pair.
Basic rules of the trading system:
1) The signal strength is calculated by the time it took to form the signal (bounce or overcome the level). The less time it took, the stronger the signal.
2) If two or more deals were opened near a certain level based on false signals (which did not trigger Take Profit or the nearest target level), then all subsequent signals from this level should be ignored.
3) In a flat, any pair can form a lot of false signals or not form them at all. But in any case, at the first signs of a flat, it is better to stop trading.
4) Trade deals are opened in the time period between the beginning of the European session and until the middle of the US one, when all deals must be closed manually.
5) On the 30-minute TF, using signals from the MACD indicator, you can trade only if there is good volatility and a trend, which is confirmed by a trend line or a trend channel.
6) If two levels are located too close to each other (from 5 to 15 points), then they should be considered as an area of support or resistance.
On the chart:
Support and Resistance Levels are the Levels that serve as targets when buying or selling the pair. You can place Take Profit near these levels.
Red lines are the channels or trend lines that display the current trend and show in which direction it is better to trade now.
The MACD indicator (14,22,3) consists of a histogram and a signal line. When they cross, this is a signal to enter the market. It is recommended to use this indicator in combination with trend lines (channels and trend lines).
Important speeches and reports (always contained in the news calendar) can greatly influence the movement of a currency pair. Therefore, during their exit, it is recommended to trade as carefully as possible or exit the market in order to avoid a sharp price reversal against the previous movement.
Beginners on Forex should remember that not every single trade has to be profitable. The development of a clear strategy and money management are the key to success in trading over a long period of time.