 English
  Русский
 Bahasa Indonesia
 Bahasa Malay
 ไทย
ไทย Español
 Deutsch
 Български
 Français
 Tiếng Việt
 中文
中文 বাংলা
বাংলা हिन्दी
 Čeština
 Українська
 Română

Details of the economic calendar for August 10
Inflation in the United States slowed down for the first time in 4 months, which became a catalyst for price spikes in financial markets. The consumer price index fell to 8.5% from a record high of 9.1%. A noteworthy point is the fact that they predicted a decline of only up to 8.7%. Such an outstanding indicator immediately became a lever for the growth of stock indices, while the US dollar was under a strong blow from sellers.
According to CME Group's FedWatch tool, traders have revised their expectations for a 0.75% Fed rate hike in September after seeing inflation data. The FedWatch indicator dropped to 32% from 68% before the report. That is, traders are inclined to believe that during the September meeting, the Fed will raise the rate by only 0.5%.
Analysis of trading charts from August 10
The EURUSD currency pair completed the formation of a three-week flat of 1.0150/1.0270 by breaking its upper limit. At that moment, there was a strong speculative interest in the market, and as a result, the euro exchange rate locally jumped in value by 150 points. We then saw a touch of the subsequent level of 1.0350, where due to the signal of overbought assets in the short term, a technical pullback occured.
The GBP/USD currency pair jumped in value by about 180 points in a speculative rally. As a result, the quote returned to the region of the local high of the current corrective move.
Economic calendar for August 11
Today, the US producer price index will be published, where a decline from 11.3% to 10.4% is epected. This will confirm the beginning of the decline in inflation itself.
At the same time with the index, weekly data on US jobless claims will be published, where a reduction in the total volume is expected. This is a positive factor for the US labor market, but due to a slight change, there may not be a reaction in the market.
Statistics details:
The volume of continuing claims for benefits may decline from 1.416 million to 1.407 million.
The volume of initial claims for benefits may rise from 260,000 to 263,000.
Time targeting:
US producer price index – 12:30 UTC
US Jobless Claims – 12:30 UTC
Trading plan for EUR/USD on August 11
At the moment, dollar positions are partially recovering in the market, while the signal about a prolonged correction from the parity level will remain.
It can be assumed that the area of the upper boundary of the previously passed flat may become a support on the pullback path—these are the values of 1.0250/1.0270. In this case, a reduction in the volume of short positions will be considered, which will lead to a stagnation and a gradual increase in the euro exchange rate.
If the quote returns below 1.0200 in a four-hour period, then the actual breakdown will be false due to speculation. The side channel 1.0150/1.0270 may again move into the active phase.

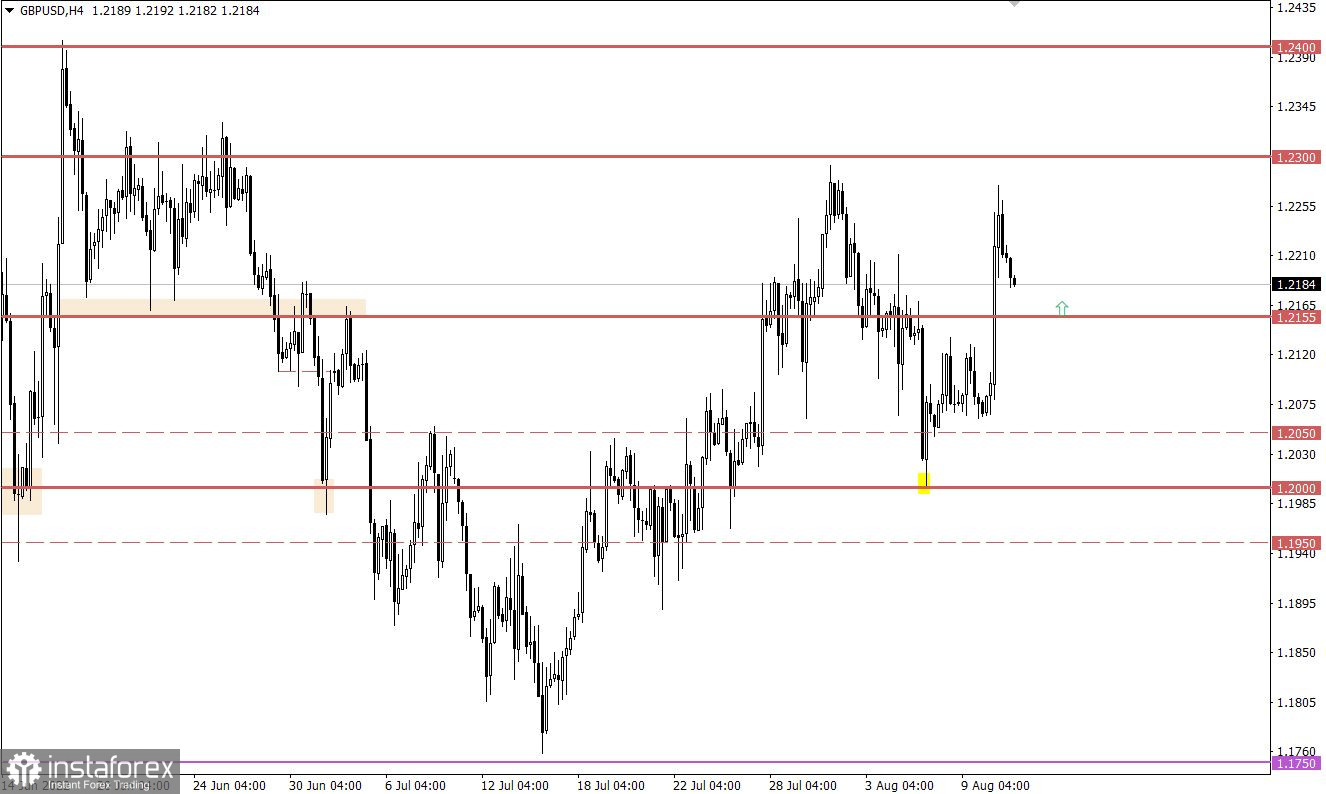
Trading plan for GBP/USD on August 11
The price area 1.2250/1.2300 became resistance on the way of speculators, where there was a reduction in the volume of long positions. Due to the local overbought of the pound sterling in the short term, a pullback occurred on the market. In this situation, the level of 1.2155 can serve as a variable support, where the quote may come during a pullback.
The upward scenario will be considered by traders after the regrouping of trading forces, in the form of a pullback. The primary signal to buy the pound may occur if the price returns above 1.2250.
What is shown in the trading charts?
A candlestick chart view is graphical rectangles of white and black light, with sticks on top and bottom. When analyzing each candle in detail, you will see its characteristics of a relative period: the opening price, closing price, and maximum and minimum prices.
Horizontal levels are price coordinates, relative to which a stop or a price reversal may occur. These levels are called support and resistance in the market.
Circles and rectangles are highlighted examples where the price of the story unfolded. This color selection indicates horizontal lines that may put pressure on the quote in the future.
The up/down arrows are the reference points of the possible price direction in the future.