 English
  Русский
 Bahasa Indonesia
 Bahasa Malay
 ไทย
ไทย Español
 Deutsch
 Български
 Français
 Tiếng Việt
 中文
中文 বাংলা
বাংলা हिन्दी
 Čeština
 Українська
 Română

In my morning forecast, I paid attention to the 1.0292 level and recommended making decisions on entering the market from it. Let's look at the 5-minute chart and figure out what happened there. The decline of the pair in the first half of the day in the area of 1.0292 and the formation of a false breakdown there – all led to an excellent entry point into long positions, which I emphasized in the morning. As a result, the upward movement amounted to more than 40 points. For the second half of the day, the technical picture was completely revised, and important fundamental data is waiting for us ahead.
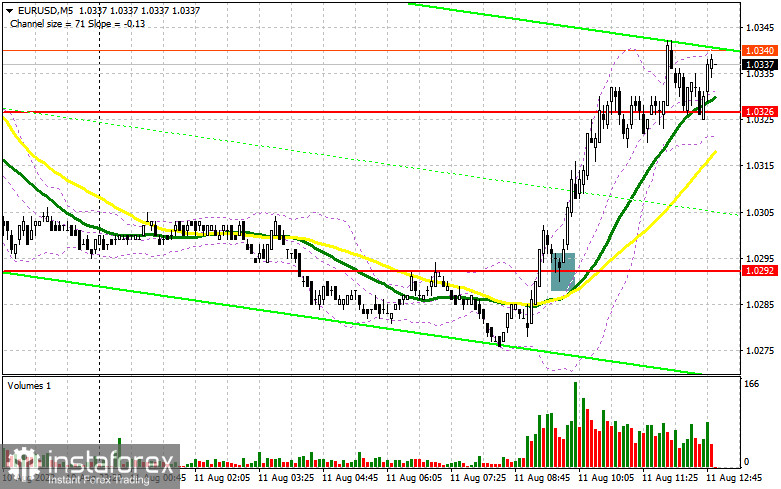
To open long positions on EURUSD, you need:
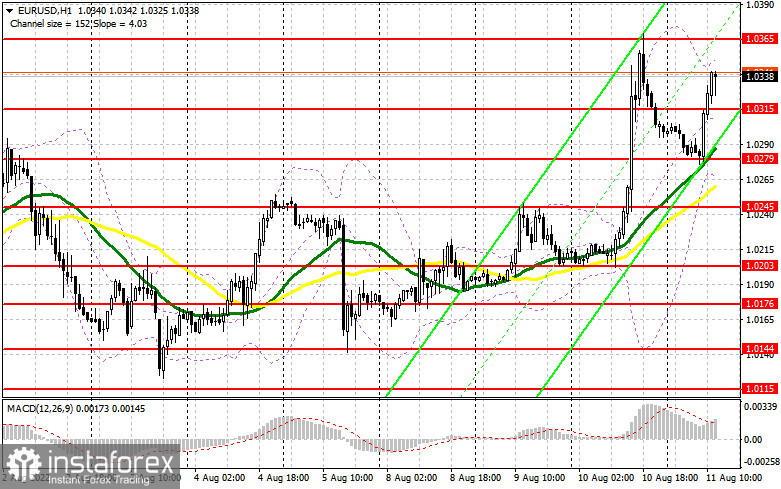
Yesterday's report on the consumer price index made a lot of noise. Today we are waiting for another inflation indicator for the United States concerning producer prices. If there is a slowdown in price growth in this component, the demand for risky assets will increase, although it is so obvious that after yesterday's rally, the bulls are not going anywhere yet. Given that the technical picture has been revised, the decline of the pair in the afternoon will be a great bonus for those who did not have time to enter the market in the morning. The formation of a false breakdown near the intermediate support of 1.0315, which was formed during the European session, will give another signal to open long positions in the hope of continuing to build an upward trend with the prospect of updating the resistance of 1.0365, which failed to break above yesterday. Only a breakout and a top-down test of this range, together with weak data on the number of initial applications for unemployment benefits in the US, will deal another blow to the bears' stop orders, forming an additional signal to enter long positions with the possibility of updating 1.0402. The farthest goal will be a new maximum of 1.0433, where I recommend fixing the profits. If EUR/USD declines and there are no buyers at 1.0315, the pressure on the pair will increase slightly, leading to another downward correction in the area of 1.0279. There are moving averages that play on the side of the bulls. A false breakdown will also be the best option for opening long positions from this level. I advise buying EUR/USD immediately for a rebound only from 1.0245, or even lower – around 1.0203 with an upward correction of 30-35 points within a day.
To open short positions on EURUSD, you need:
It all depends on inflation and market reaction. Even if producer price inflation increases, the main thing is not to exceed the June figures. If they want to offer something to the market, bears need to try to protect the nearest resistance of 1.0365, and it is best to close the day below the nearest support of 1.0315. A good option to sell would be a false breakdown around 1.0365 after several fundamental statistics, leading to the euro's movement down to 1.0315. A breakdown and consolidation below this range and a reverse test from the bottom up form an additional sell signal with the demolition of buyers' stop orders and a larger pair movement to the 1.0279 area. Fixing below this area will destroy all buyers' plans to build an upward trend, opening a direct road to 1.0245, where I recommend completely exiting sales. A more distant target will be the 1.0203 area, but this is already the best scenario for sellers. In case of further upward movement of EUR/USD during the American session and the absence of bears at 1.0365, I advise you to postpone short positions to 1.0402, but only if a false breakdown is formed there. You can sell EUR/USD immediately on a rebound from the maximum of 1.0433, or even higher – from 1.0460 with the aim of a downward correction of 30-35 points.
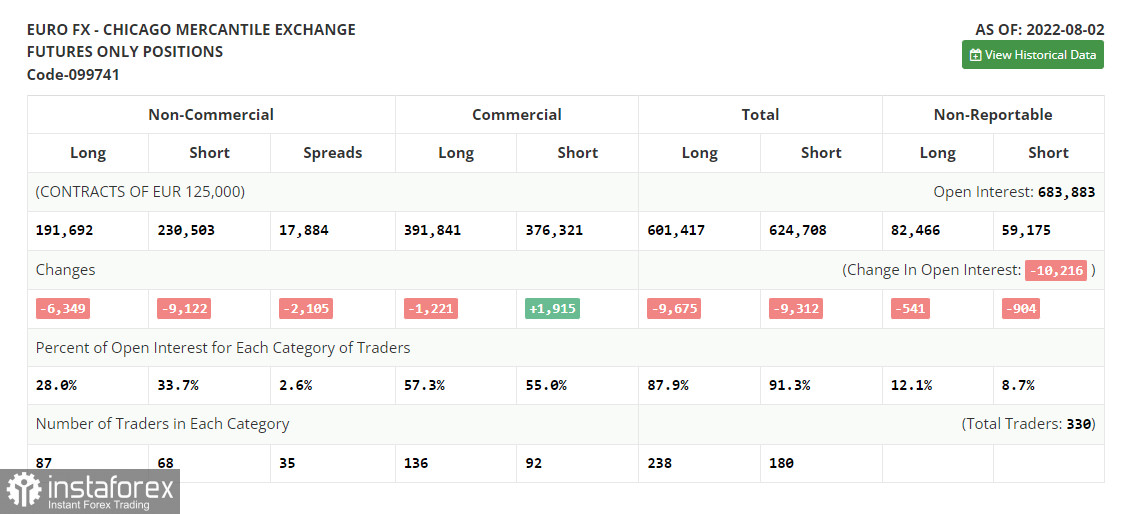
The COT report (Commitment of Traders) for August 2 recorded a sharp reduction in both short and long positions, but the decline in the latter turned out to be greater, which continues to indicate the gradual end of the bear market and an attempt to find the market bottom after reaching parity of the euro against the US dollar. Last week, the statistics on the eurozone did not please us much, which cannot be said about the data on the United States and the strong labor market, which once again reminded investors that even in conditions of high inflation, the American economy would be able to confidently survive the impending recession and high-interest rates. The reduction in the positions of buyers and sellers can soon be written off for the summer period. In August, the activity of traders may become even lower, which should not be surprising. In the near future, we will find out how things are with inflation in the United States and whether the recent aggressive increases in the key interest rate by the Central Bank have benefited. If inflation in the US starts to decline, it will be a clear reason to build up long positions in risky assets. The COT report indicates that long non-commercial positions decreased by 6,349 to 191,692, while short non-commercial positions decreased by 9,122 to 230,503. At the end of the week, the total non-commercial net position, although it remained negative, increased slightly — from -41,584 to -39,811, which indicates the continuation of the market's turn to the side of euro buyers. The weekly closing price rose to 1.0206 against 1.0161.
- Moving average (moving average determines the current trend by smoothing out volatility and noise). Period 50. The graph is marked in yellow.
- Moving average (moving average determines the current trend by smoothing out volatility and noise). Period 30. The graph is marked in green.
- MACD indicator (Moving Average Convergence / Divergence - moving average convergence/divergence) Fast EMA period 12. Slow EMA period 26. SMA period 9
- Bollinger Bands (Bollinger Bands). Period 20
- Non-profit speculative traders, such as individual traders, hedge funds, and large institutions use the futures market for speculative purposes and to meet certain requirements.
- Long non-commercial positions represent the total long open position of non-commercial traders.
- Short non-commercial positions represent the total short open position of non-commercial traders.
- Total non-commercial net position is the difference between the short and long positions of non-commercial traders.