 English
  Русский
 Bahasa Indonesia
 Bahasa Malay
 ไทย
ไทย Español
 Deutsch
 Български
 Français
 Tiếng Việt
 中文
中文 বাংলা
বাংলা हिन्दी
 Čeština
 Українська
 Română

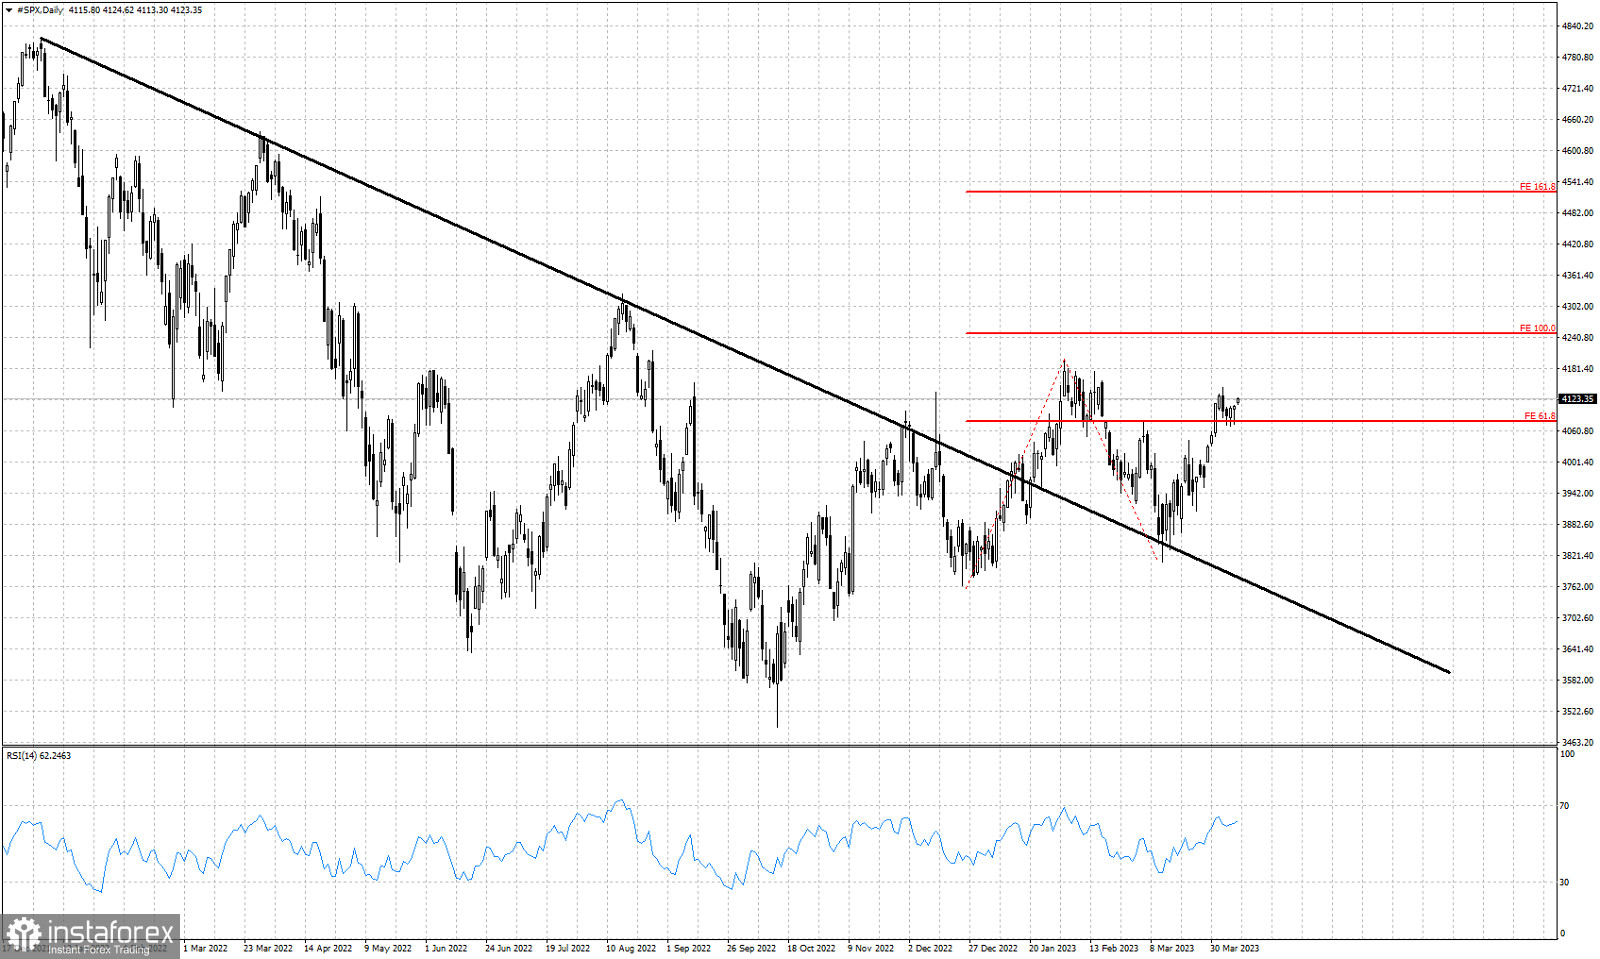
Black line- resistance trend line (broken)
Red lines- Fibonacci extension targets
SPX is trading around 4,119. Short-term trend remains bullish after the 3,800 area bottom. In a previous analysis we mentioned that current price pattern suggests that SPX is heading towards 4,250 and this target remains our primary focus. On a daily basis the RSI has still not reached overbought levels. Price continues making higher highs and higher lows. The previous highs at 4,195 are the next resistance level bulls need to break. A double top rejection at 4,195 would be a bearish sign. As we approach this resistance level bulls need to be cautious.