 English
  Русский
 Bahasa Indonesia
 Bahasa Malay
 ไทย
ไทย Español
 Deutsch
 Български
 Français
 Tiếng Việt
 中文
中文 বাংলা
বাংলা हिन्दी
 Čeština
 Українська
 Română

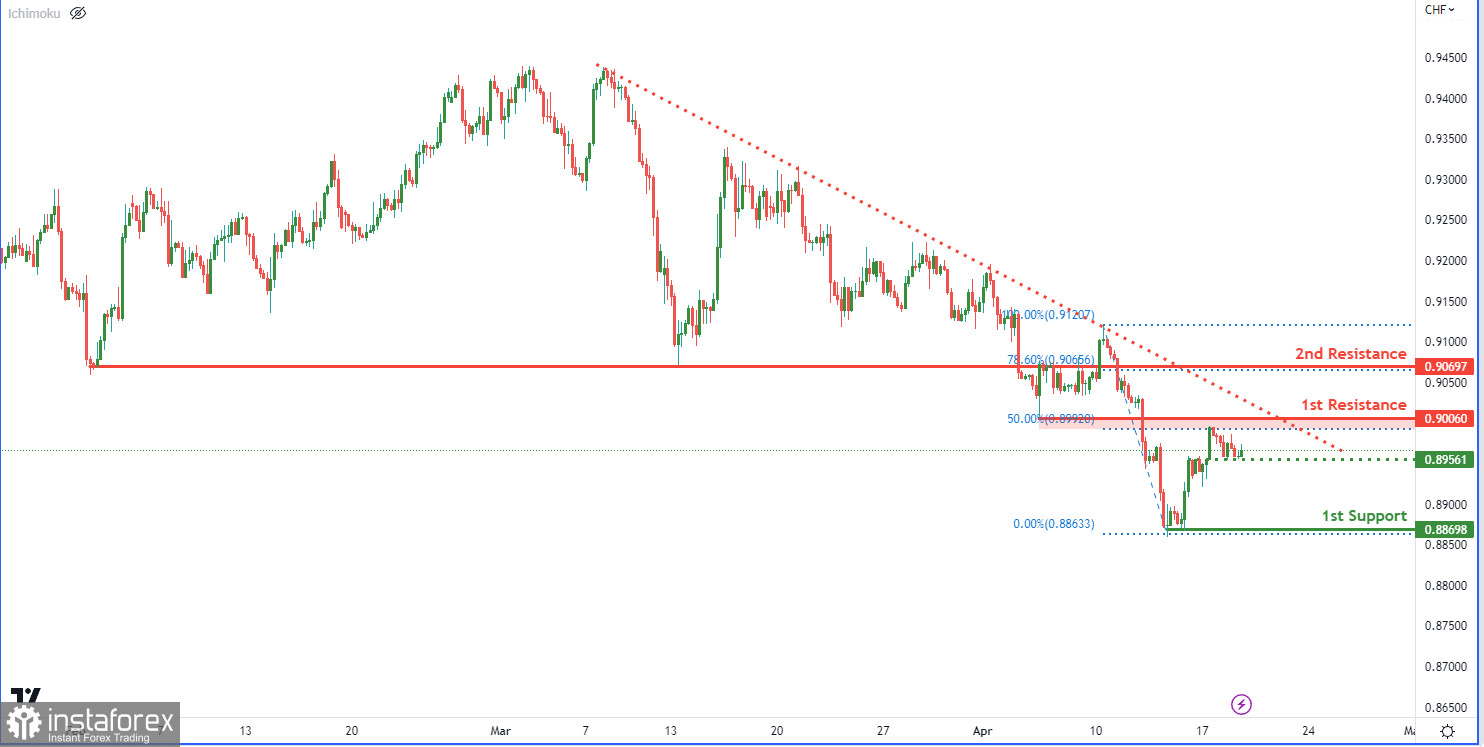 The USD/CHF chart exhibits a bearish bias due to the presence of a major descending trend line, indicating a potential further downside movement. In this scenario, the 1st resistance level at 0.9006 could serve as a good area for pullbacks. It is an overlap resistance and coincides with a 50% Fibonacci retracement level, making it a significant level to watch out for. Failure to break this resistance level could lead to a bearish continuation, with the 1st support level at 0.8869 providing a strong multi-swing low support level.
In the event that the 1st support level is breached, a brief halt to the bearish momentum could occur at the intermediate support level of 0.8956. If this level fails to hold, the pair may potentially move towards the 2nd support level at 0.8749, which also serves as a multi-swing low support level.