 English
  Русский
 Bahasa Indonesia
 Bahasa Malay
 ไทย
ไทย Español
 Deutsch
 Български
 Français
 Tiếng Việt
 中文
中文 বাংলা
বাংলা हिन्दी
 Čeština
 Українська
 Română

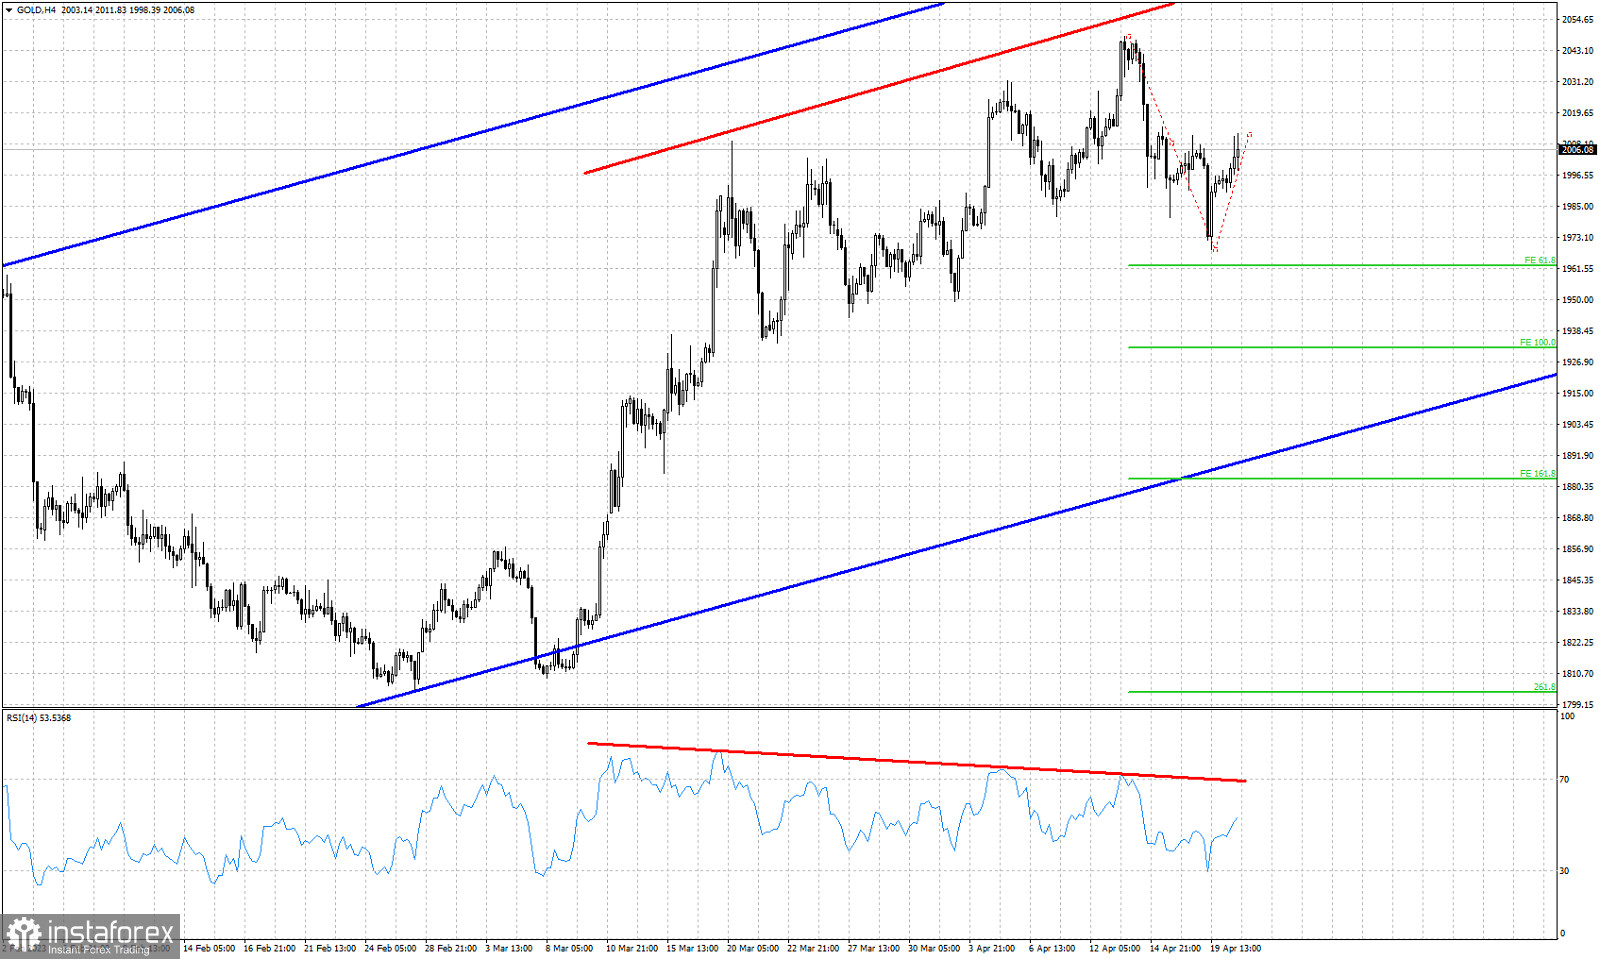
Red lines- bearish RSI divergence
Blue lines- bullish channel
Green lines- Fibonacci extension targets
Gold price is trading around $2,007. Price has bounced off the $1,968 low. If price forms a lower high and turns lower, then price will be expected to move towards the lower channel boundary close to $1,930-20 area. The bearish RSI divergence suggests that the most probable scenario is for Gold price to make another leg lower. Short-term resistance is at $2,014. As long as price is below this level we remain short-term bearish expecting that the more likely outcome would be another move lower. Support is at $1,990. This is a very crucial short-term support level. Bears need to break below this price in order to regain control of the trend.