 English
  Русский
 Bahasa Indonesia
 Bahasa Malay
 ไทย
ไทย Español
 Deutsch
 Български
 Français
 Tiếng Việt
 中文
中文 বাংলা
বাংলা हिन्दी
 Čeština
 Українська
 Română

USD/JPY:
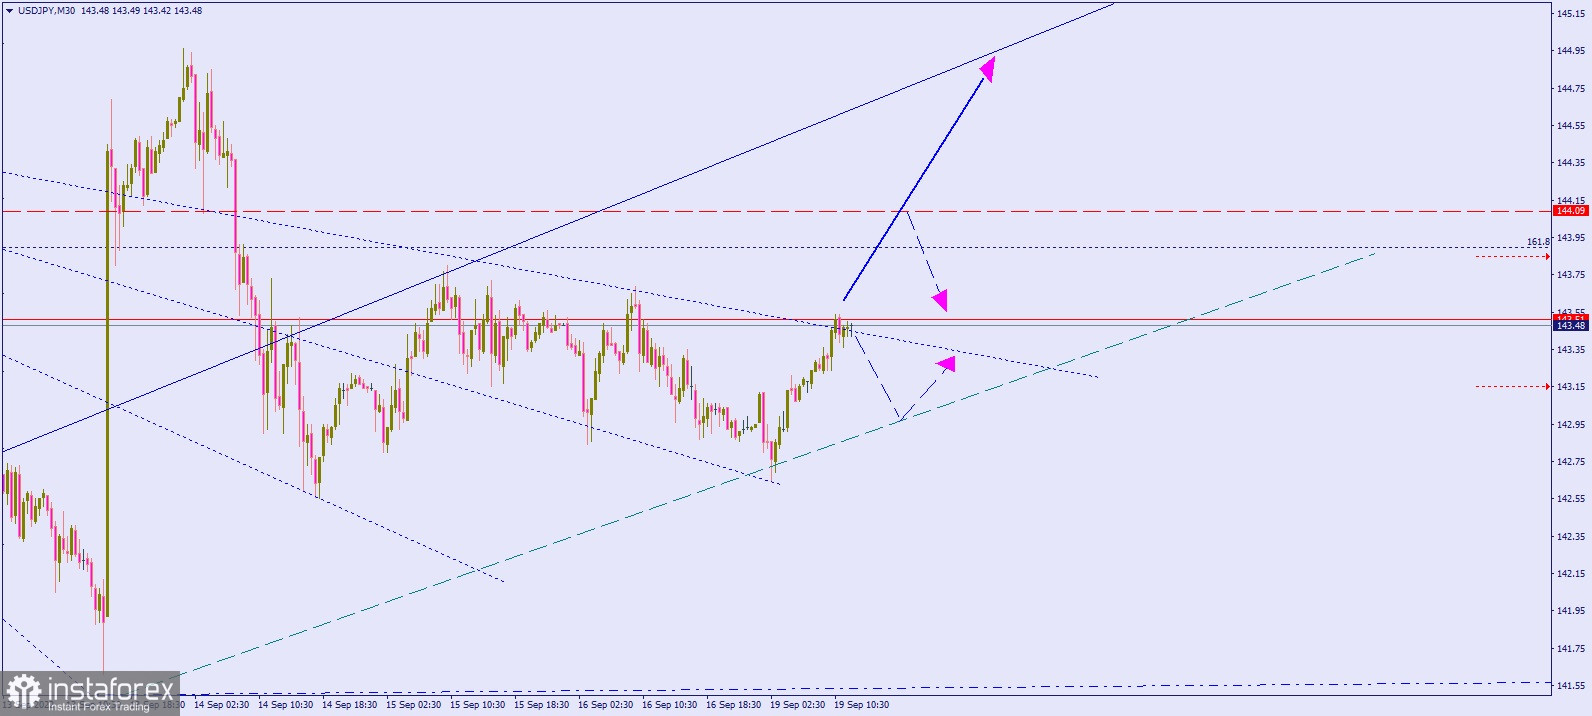
The chart shows the movement of USD/JPY in the 30-minute (M30) chart.
The pair is currently trading at the resistance level of £ 143.50. Its breakdown will pave the way for further growth towards £144.00 per $1. Meanwhile, the breakdown of £144.00 will lead to a rise to £145.00.
In case of a rebound, the pair will head towards £143.00.
Good luck!