 English
  Русский
 Bahasa Indonesia
 Bahasa Malay
 ไทย
ไทย Español
 Deutsch
 Български
 Français
 Tiếng Việt
 中文
中文 বাংলা
বাংলা हिन्दी
 Čeština
 Українська
 Română

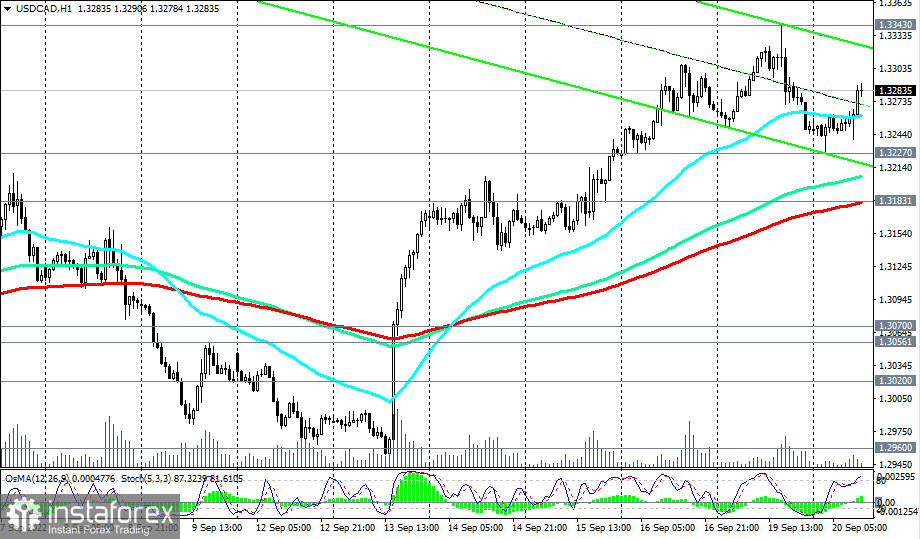
As of writing, USD/CAD is trading near 1.3285, above important short-term support levels 1.3183 (200 EMA on the 1-hour chart), 1.3056 (200 EMA on the 4-hour chart), and medium-term support level 1.3020 (50 EMA on the daily chart).
In an alternative scenario, and after the breakdown of the local (1.3227) and short-term (1.3183) support levels, the downward correction may continue up to the support levels of 1.3056, 1.3020.
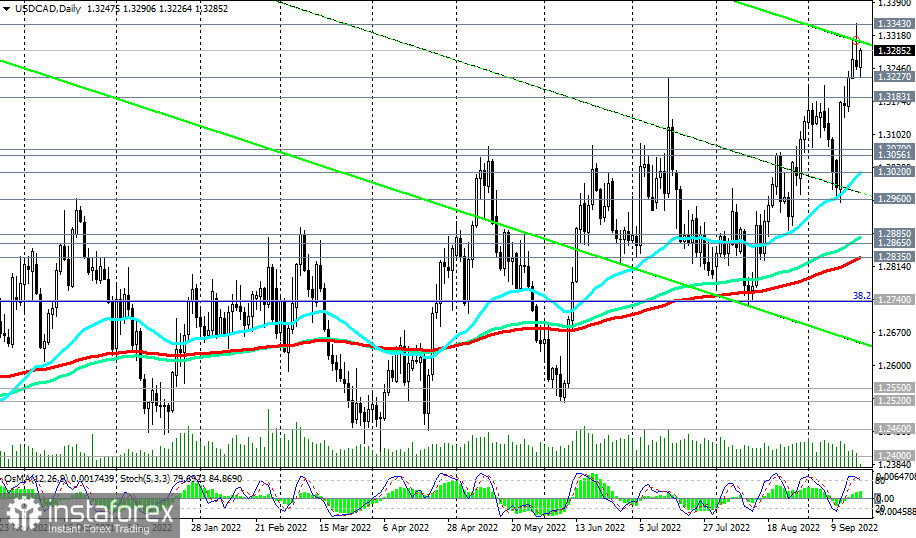
A deeper decline is unlikely. Given the strong upward momentum, it is logical to assume further growth. USD/CAD is in the bull market zone, above the key support levels 1.2865 (200 EMA on the weekly chart), 1.2835 (200 EMA on the daily chart).
The driver of today's movements in the USD/CAD pair may be the publication at (12:30 GMT) of consumer price indices in Canada.
The breakdown of the local resistance level (and this month's high) at 1.3343 will be a confirmation signal for new long positions in USD/CAD.
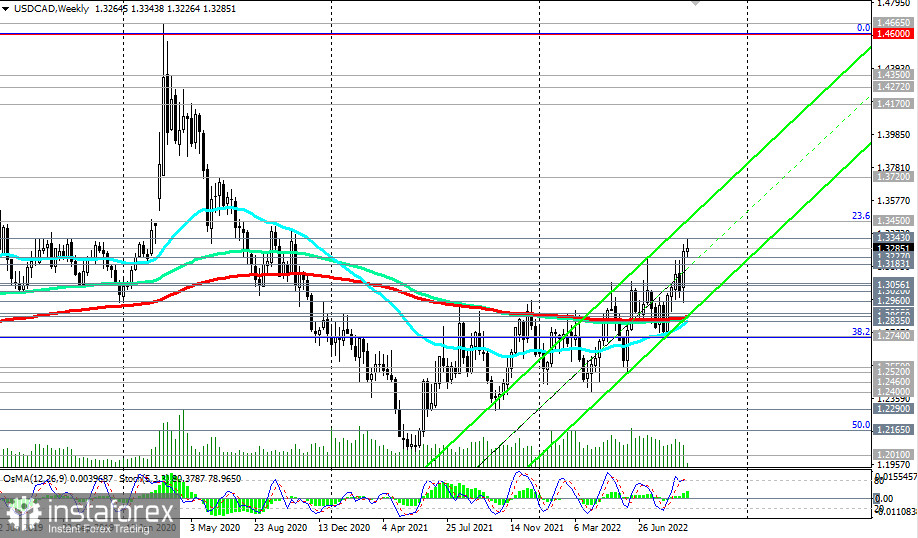
But a breakdown of the support levels 1.2835, 1.2740 (38.2% Fibonacci retracement of the downward correction in the USD/CAD growth wave from 0.9700 to 1.4600) will return USD/CAD to the bearish market zone.
Support levels: 1.3227, 1.3183, 1.3070, 1.3056, 1.3020, 1.2960, 1.2885, 1.2865, 1.2835, 1.2740
Resistance levels: 1.3300, 1.3343
Trading Tips
Sell Stop 1.3220. Stop-Loss 1.3320. Take-Profit 1.3183, 1.3070, 1.3056, 1.3020, 1.2960, 1.2885, 1.2865, 1.2835, 1.2740
Buy Stop 1.3320. Stop-Loss 1.3220. Take-Profit 1.3340, 1.3400, 1.3500