 English
  Русский
 Bahasa Indonesia
 Bahasa Malay
 ไทย
ไทย Español
 Deutsch
 Български
 Français
 Tiếng Việt
 中文
中文 বাংলা
বাংলা हिन्दी
 Čeština
 Українська
 Română

Trend analysis (Fig. 1)
GBP/USD will continue decreasing on Wednesday, starting from 1.1356 (closing of yesterday's daily candle) to 1.1327, which is the support line of the downward channel (red thick line). Then, it will bounce up to the 14.6% retracement level at 1.1406 (dashed blue line) and to the 38.2% retracement level at 1.1497 (dashed blue line).
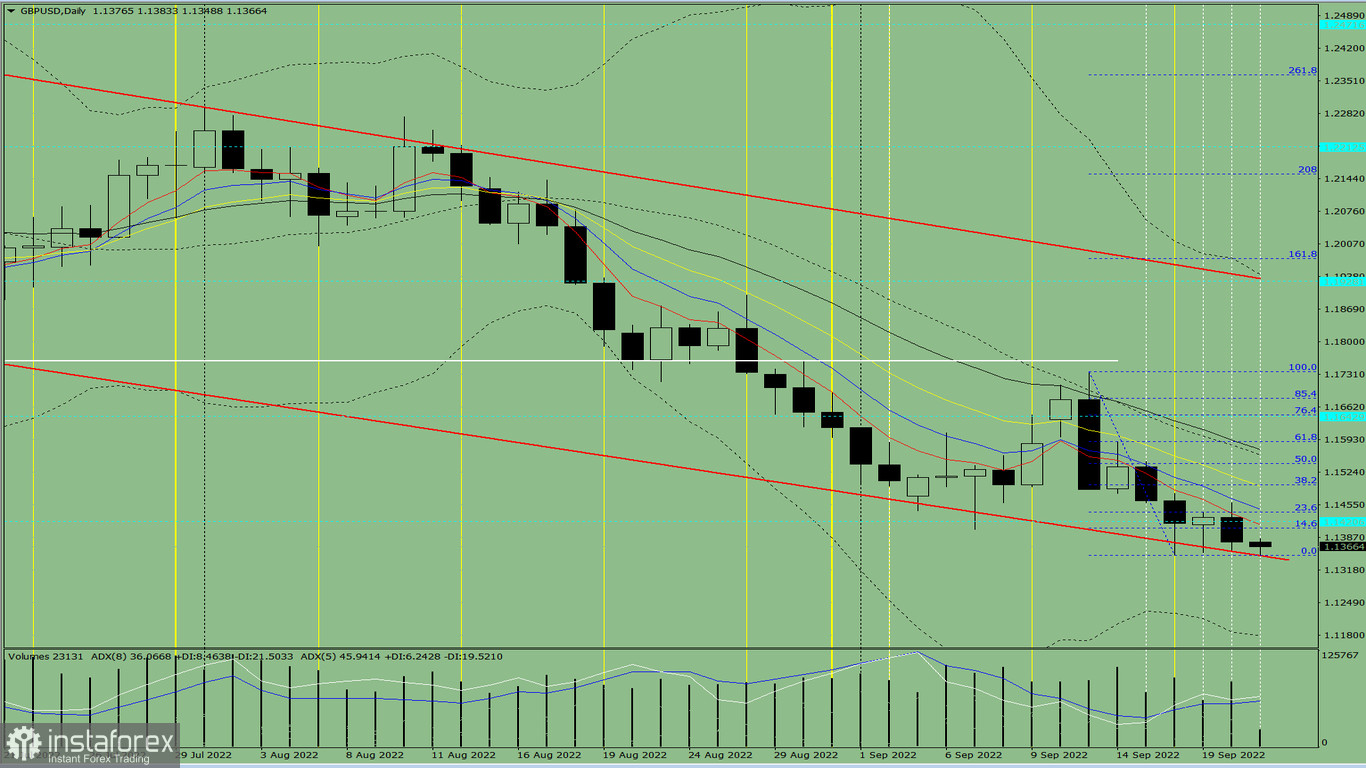
Fig. 1 (daily chart)
Comprehensive analysis:
Indicator analysis -uptrend
Fibonacci levels - uptrend
Volumes - uptrend
Candlestick analysis - uptrend
Trend analysis - uptrend
Bollinger bands - downtrend
Weekly chart - uptrend
Conclusion: GBP/USD will move down from 1.1356 (closing of yesterday's daily candle) to the support line of the downward channel at 1.1327 (red thick line), then bounce up to the 14.6% retracement level at 1.1406 (dashed blue line) and the 38.2% retracement level at 1.1497 (dashed blue line).
Alternatively, the pair could decline from 1.1356 (closing of yesterday's daily candle) to the lower border of the Bollinger line at 1.1169 (black dotted line), then bounce back to the lower fractal at 1.1349 (blue dotted line) and to higher price levels.