 English
  Русский
 Bahasa Indonesia
 Bahasa Malay
 ไทย
ไทย Español
 Deutsch
 Български
 Français
 Tiếng Việt
 中文
中文 বাংলা
বাংলা हिन्दी
 Čeština
 Українська
 Română

Trend analysis
EUR/USD will attempt to move down this week, starting from 0.9688 (closing of the last weekly candle) to 0.9627, which is the support line of the downward channel (thick red line). Then, it will bounce up to the 14.6% retracement level at 0.9733 (yellow dotted line) and to the 23.6% retracement level at 0.9844 (yellow dotted line). Quotes will dip again from this level.
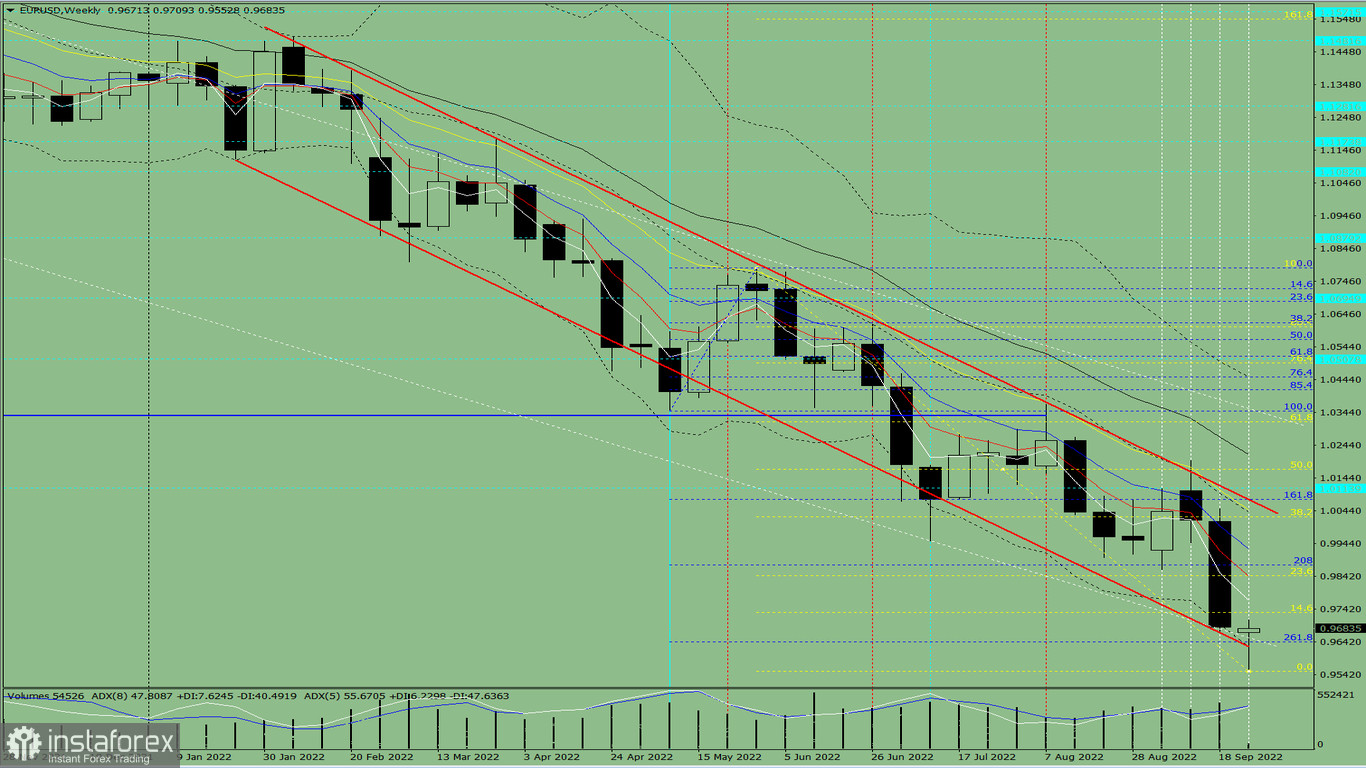
Fig. 1 (weekly chart)
Comprehensive analysis:
Indicator analysis - uptrend
Fibonacci levels - uptrend
Volumes - uptrend
Candlestick analysis - uptrend
Trend analysis - uptrend
Bollinger bands - downtrend
Monthly chart - uptrend
All this points to an upward movement in EUR/USD.
Conclusion: The pair will have a bullish trend, with no first lower shadow on the weekly white candle (Monday - up) and no second upper shadow (Friday - up).
So during the week, euro will fall from 0.9688 (closing of the last weekly candle) to the support line of the downward channel at 0.9627 (red thick line), then move to the 14.6% retracement level at 0.9731 (yellow dotted line) and 23.6% retracement level at 0.9844 (yellow dotted line). Quotes will dip again from this level.
Alternatively, the pair could drop from 0.9688 (closing of the last weekly candle) to the 261.8% retracement level at 0.9641 (dashed blue line), then go to the 14.6% retracement level at 0.9731 (yellow dotted line).