 English
  Русский
 Bahasa Indonesia
 Bahasa Malay
 ไทย
ไทย Español
 Deutsch
 Български
 Français
 Tiếng Việt
 中文
中文 বাংলা
বাংলা हिन्दी
 Čeština
 Українська
 Română

Bitcoin spent the weekend consolidating within a narrow range. The decline in overall trading activity did not affect the cryptocurrency quotes in any way since the interest of retail investors is at a minimum. Bitcoin starts the new week with the formation of a dangerous bearish pattern near the $18.9k level.
After a powerful market crash on September 13 and the formation of one of the largest bearish candles in recent times, BTC/USD has taken a downward direction. On the daily chart of the cryptocurrency, we see a gradual narrowing of the range of fluctuations, which can have far-reaching consequences.
Is the market preparing to sink to the bottom?
On September 22, buyers formed large volumes and converted them into a green candle. However, it was not possible to develop local success in the future. An unsuccessful attempt to carry out a local rebound exacerbated market sentiment. According to the Santiment report, the cryptocurrency market is experiencing extreme negative sentiment due to failed rebound attempts.
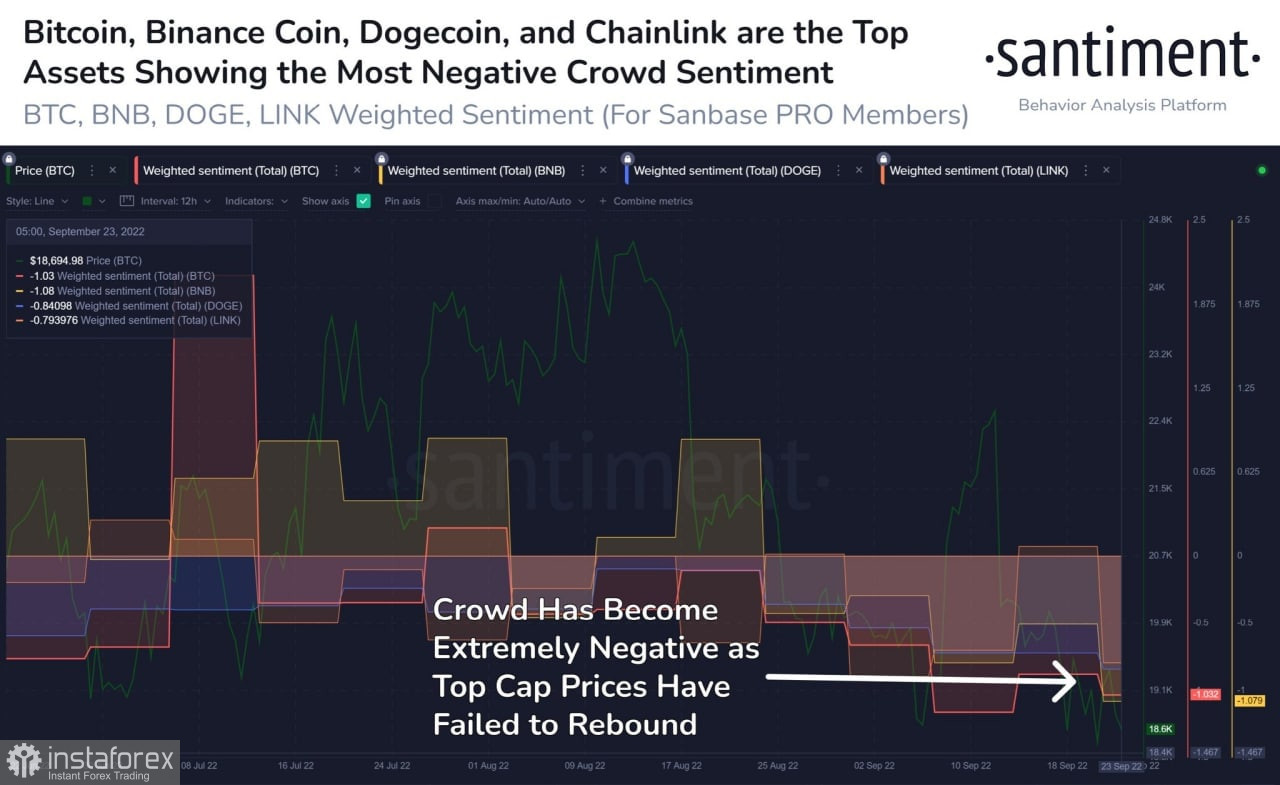
This leads investors to take concrete action to protect their interests near or below the local low at $17.7k. Each unsuccessful attempt to rebound leads to the saturation of the zone under the local bottom with liquidity. And judging by the price action on the daily chart, the market is gearing up to harvest below $17.7k.
Bitcoin Technical analysis
On the daily chart of BTC/USD, the price is tightening and a descending triangle pattern is forming. The breakdown of this figure will likely be a breakdown of the $17.7k level and an update of the local bottom.
Buying volumes are at their lowest level in the current bear market. Another increase in the key rate is forcing investors to sell their assets in order to avoid margin calls. The result is an ideal situation to update the local bottom and collect large amounts of liquidity below $17.7k.
The formation of a descending triangle may become a prerequisite for a subsequent update of the market bottom. Technical indicators generally show a lull, but, most likely, bearish pressure will resume with the opening of US markets.
Last week, the stochastic oscillator managed to break out of the oversold zone, but subsequently the metric again fell below the 20 level. This is another clear evidence of the weakness of the buyers and the lack of volume needed to protect $17.7k.
S&P 500 Analysis
SPX continues to fall and reaches the key support zone at $3,640. Near this level, there are signs of activation of buyers. The bulls managed to move the price away from the important level and as of September 26, the index is trading near $3,700.
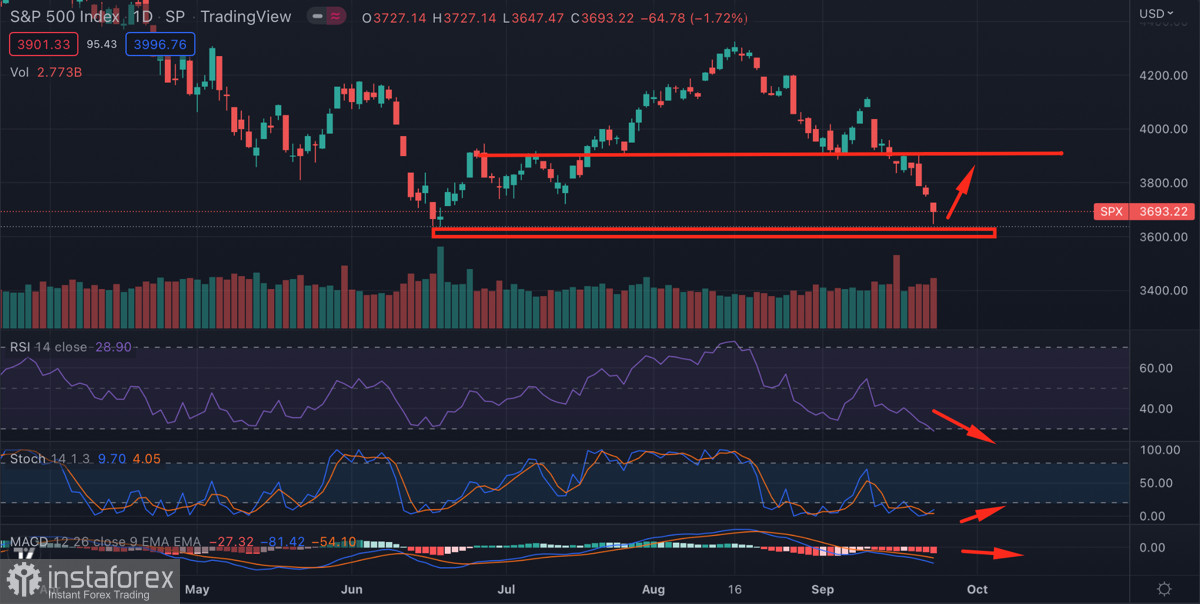
It is important to note that over the past few days, the correlation between Bitcoin and SPX has cracked. The stock index continued to decline while the cryptocurrency stubbornly resisted and remained in a tight range. Judging by the successful rebound of SPX, it will become clear in the near future whether BTC will follow the stock index in an upward movement.
DXY Analysis
An interesting situation arose with the US dollar index. The asset peaked at 114.5 but subsequently faced increased selling pressure. On the monthly chart, we see that the price has almost reached the high of 2003–2004.
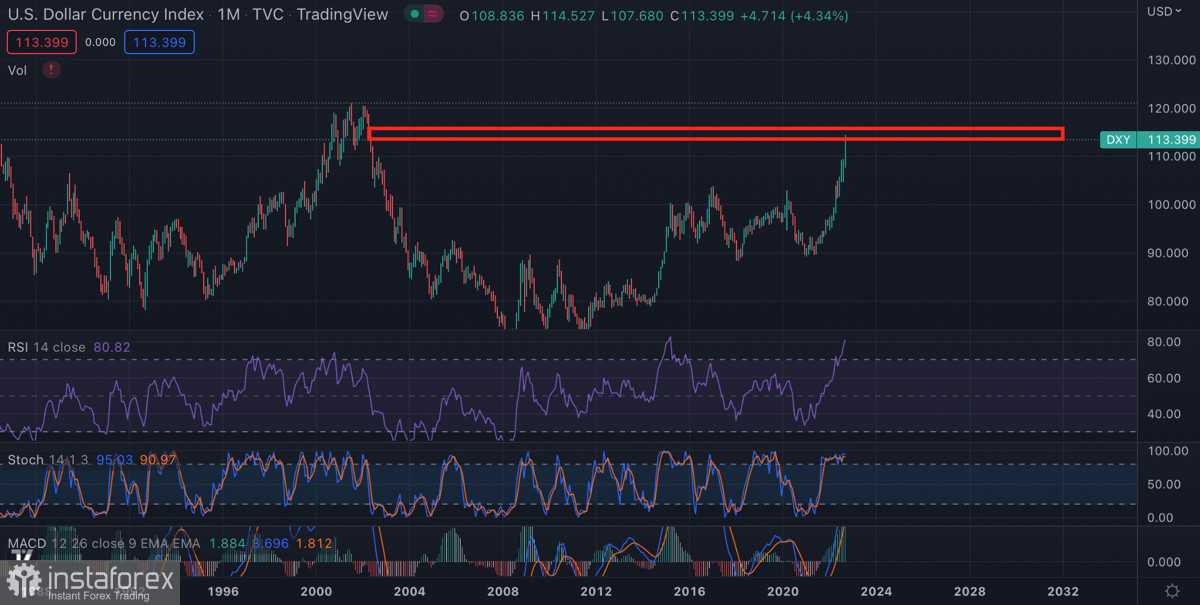
The technical metrics of the asset on the monthly chart are deep in the overbought zone. It is likely that we will soon face a serious correction in the DXY index, as the asset has reached an absolute peak in all indicators.
Conclusions
There is a high probability that Bitcoin will update the local low in the next two weeks. Technical metrics and another peak moment of negative news have a positive effect on the positions of sellers.
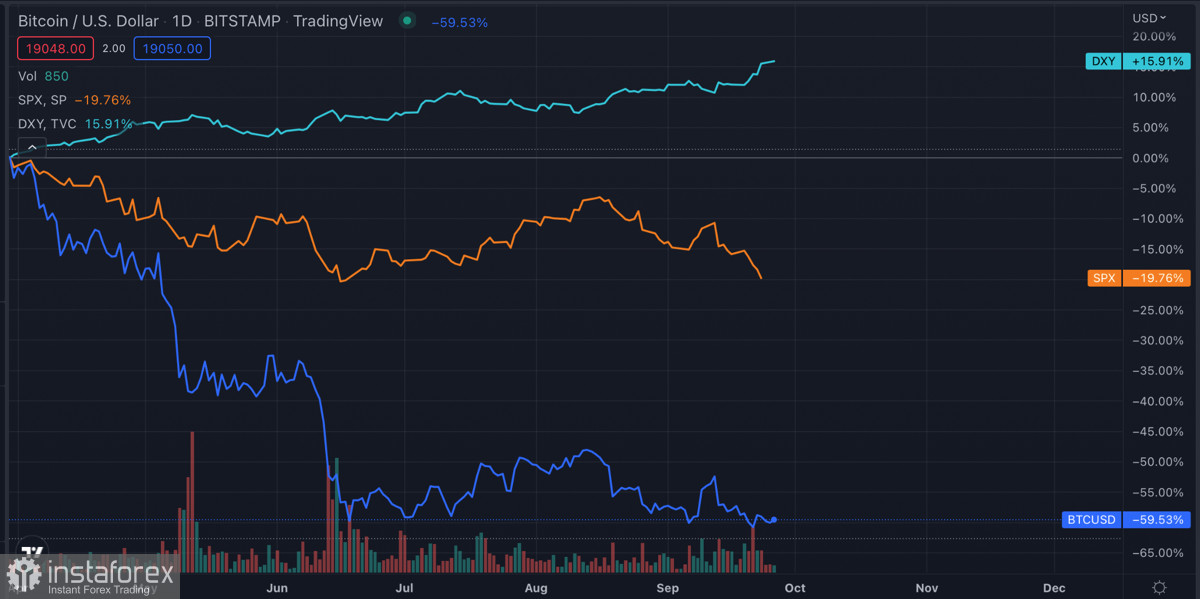
In the medium term, the markets may be overwhelmed by an upward trend. The impending DXY correction will exceed the drop in the price of the index during the month of the summer. In parallel with the corrective movement of the dollar index, the stock and crypto markets updated local highs. It is likely that we will observe a similar picture in the second half of autumn.