 English
  Русский
 Bahasa Indonesia
 Bahasa Malay
 ไทย
ไทย Español
 Deutsch
 Български
 Français
 Tiếng Việt
 中文
中文 বাংলা
বাংলা हिन्दी
 Čeština
 Українська
 Română

Trend analysis (Fig. 1).
On Tuesday, moving up from the level of 1.0671 (closing of yesterday's daily candlestick), the price will try to reach the 38.2% retracement level of 1.0875 (blue dotted line). Should the quote test the barrier, the price will rise to the target standing at the 50.0% retracement level of 1.0875 (blue dotted line) and then go down.
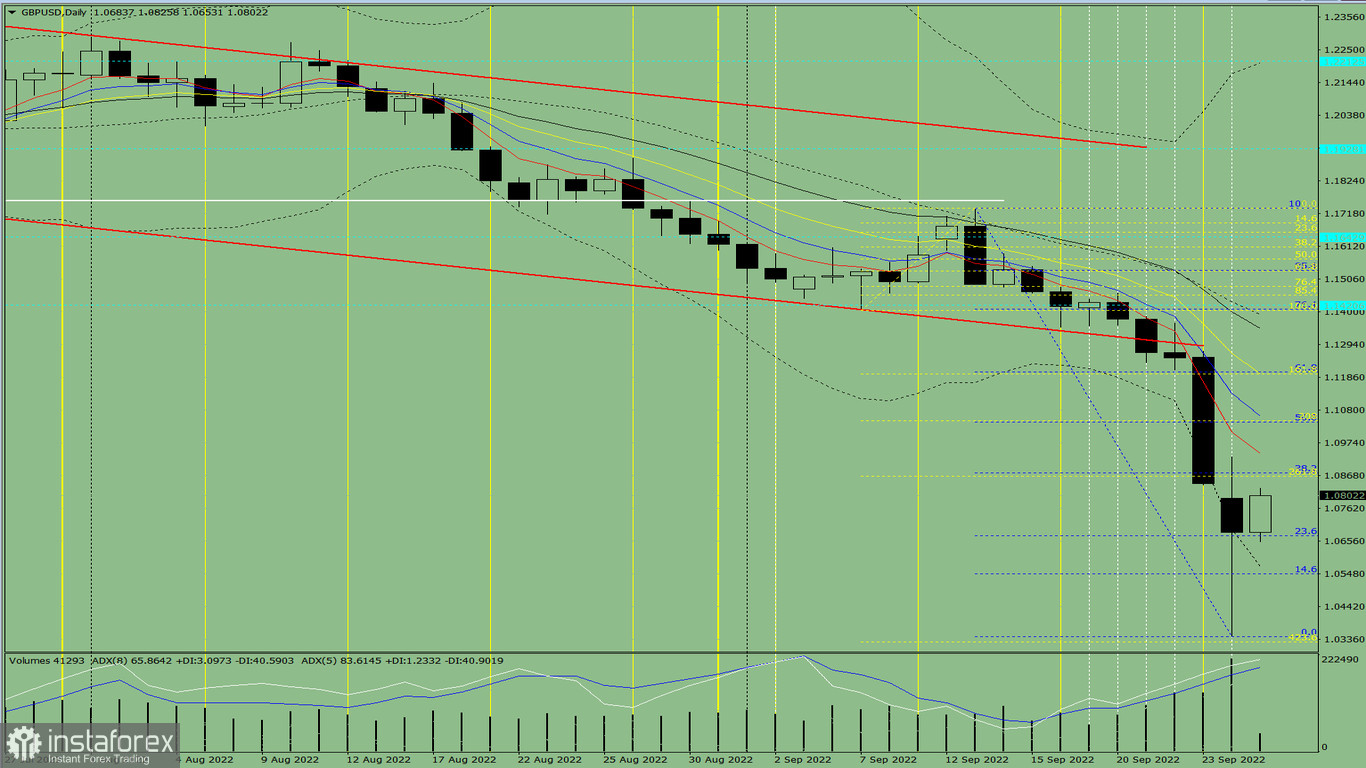
Fig. 1 (daily chart)
Complex analysis:
- indicator analysis - up
- Fibonacci levels - up
- volumes - up
- candlestick analysis - up
- trend analysis - up
- Bollinger bands - up
- weekly chart - up
Final thoughts:
Today, moving up from the level of 1.0671 (closing of yesterday's daily candlestick), the price will try to reach the 38.2% retracement level of 1.0875 (blue dotted line). Should the quote test the barrier, the price will rise to the target standing at the 50.0% retracement level of 1.0875 (blue dotted line) and then go down.
Alternative scenario: moving down from the level of 1.0671 (closing of yesterday's daily candlestick), the quote will try to get to the 14.6% retracement level of 1.0546 (blue dotted line). If the barrier is tested, the price could retrace up to the 38.2% retracement level of 1.0875 (blue dotted line).