 English
  Русский
 Bahasa Indonesia
 Bahasa Malay
 ไทย
ไทย Español
 Deutsch
 Български
 Français
 Tiếng Việt
 中文
中文 বাংলা
বাংলা हिन्दी
 Čeština
 Українська
 Română

USD/JPY:
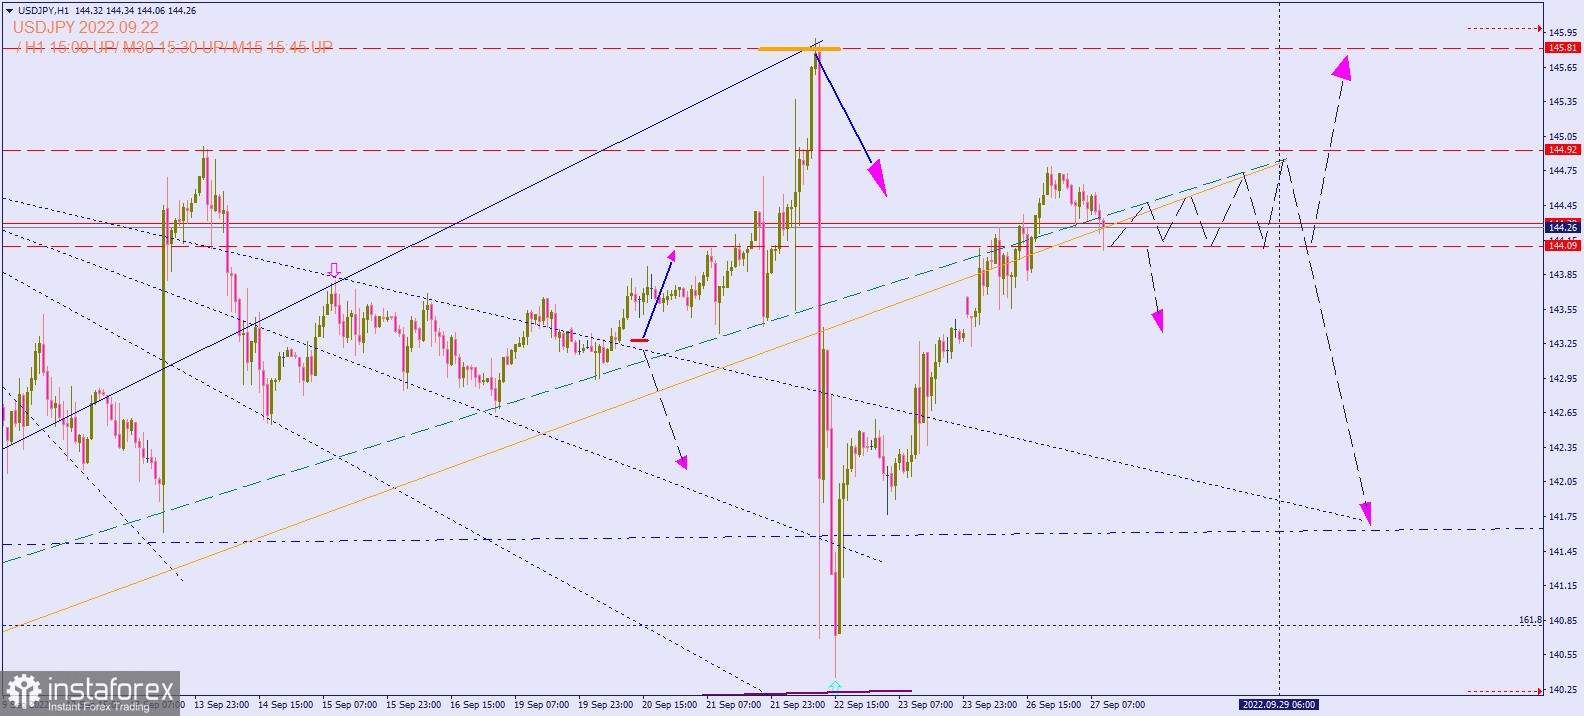
The chart shows the movement of #USD/JPY in the hourly (H1) chart.
Comparing the recent price movement to that of September 20 and 22's, it can be seen clearly that the key support level is £144.09, while the dynamic resistance levels are the two sloping lines converging on September 29's high, that is, £144.92.
Based on this, it is likely that a breakdown of the support level of £144.09 will lead to a drop towards £141.60, while a test and breakdown of £144.92 will result in a rise to £145.81. Either way, trading in the short-term is very risky, so be careful when entering and exiting the market.
Good luck!