 English
  Русский
 Bahasa Indonesia
 Bahasa Malay
 ไทย
ไทย Español
 Deutsch
 Български
 Français
 Tiếng Việt
 中文
中文 বাংলা
বাংলা हिन्दी
 Čeština
 Українська
 Română

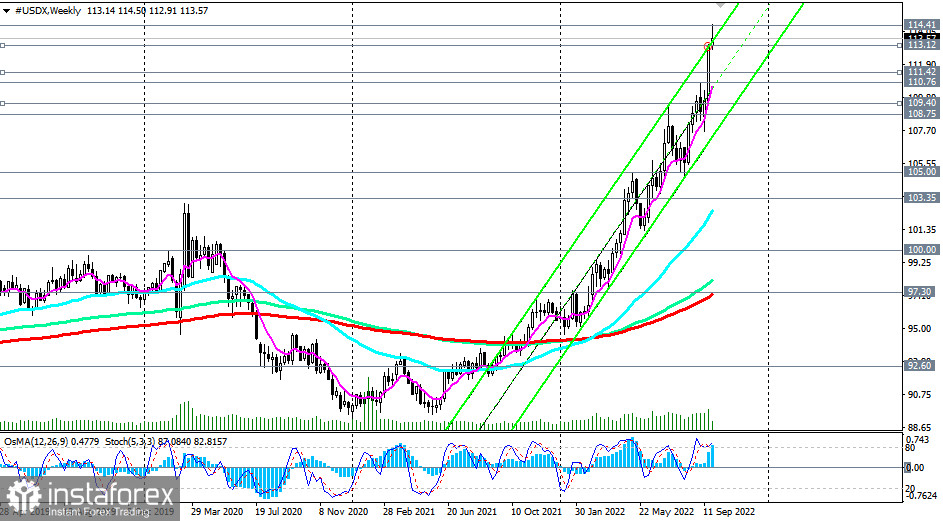
As of writing, the dollar index (CFD #USDX) is trading near 113.55, down from yesterday's new local high near 114.41.
The dollar's upward trend continues, pushing the DXY to new highs on its way to over 20-year highs near 120.00, 121.00. The break of yesterday's local high at 114.41 will be a confirmation signal of our assumption.
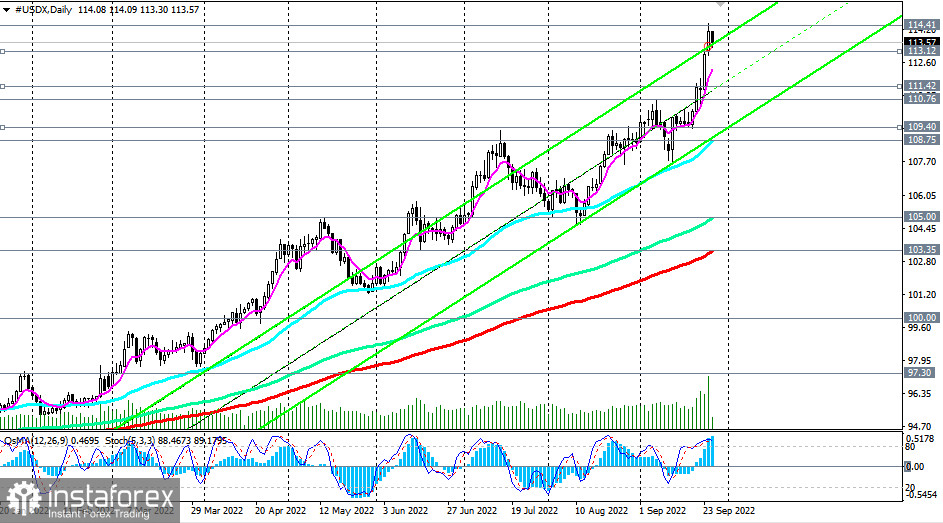
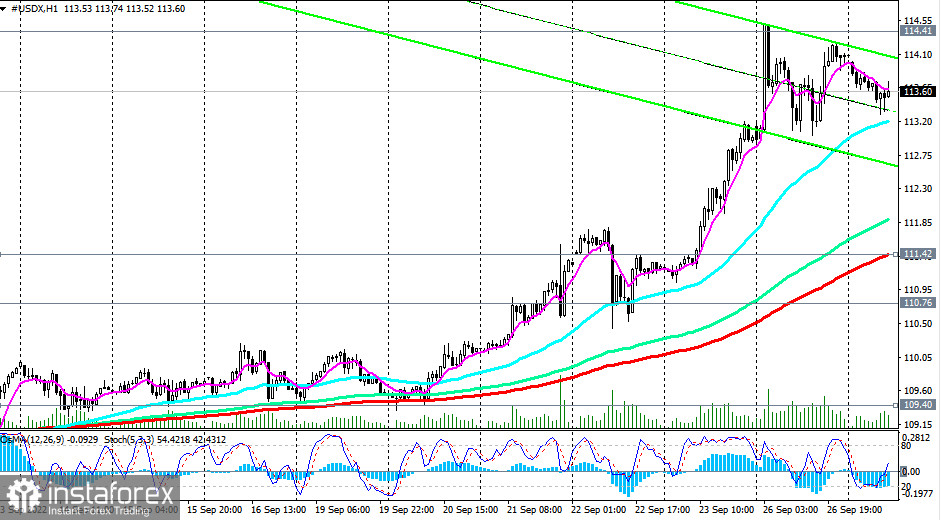
Alternatively, the very first signal for short-term selling will be a breakdown of the short-term support level 113.12 (200 EMA on the 15-minute CFD #USDX chart). The target is the important short-term support level 111.42 (200 EMA on the 1-hour chart). Its breakdown, in turn, may provoke a deeper correction to the support levels of 109.40 (200 EMA on the 4-hour chart), 108.75 (50 EMA and the lower line of the rising channel on the daily chart). However, once again we note that this is an alternative and theoretically possible scenario.
Strong bullish momentum prevails based on fundamental factors, favoring long positions.
Support levels: 113.12, 111.42, 110.76, 109.40, 108.75, 105.00, 103.35
Resistance levels: 114.00, 114.41, 115.00
Trading Tips
Sell Stop 112.90. Stop Loss 114.30. Take-Profit 111.42, 110.76, 109.40, 108.75, 105.00, 103.35
Buy Stop 114.30. Stop-Loss 112.90. Take-Profit 114.41, 115.00, 116.00, 120.00