 English
  Русский
 Bahasa Indonesia
 Bahasa Malay
 ไทย
ไทย Español
 Deutsch
 Български
 Français
 Tiếng Việt
 中文
中文 বাংলা
বাংলা हिन्दी
 Čeština
 Українська
 Română

The euro remained almost unchanged in the first half of the day although bears made an attempt to push it below 0.9620. Now, let's look at the 5-minute chart and try to figure out what actually happened. In the morning article, I turned your attention to the level of 0.9620 and recommended making decisions with this level in focus. A buy signal appeared after bears failed to push the pair below this level due to the lack of fundamental reports and statistics and a false breakout. However, the pair was unable to climb considerably. At the time of writing the article, the pair rose about 25 pips. In the afternoon, the technical outlook slightly changed.
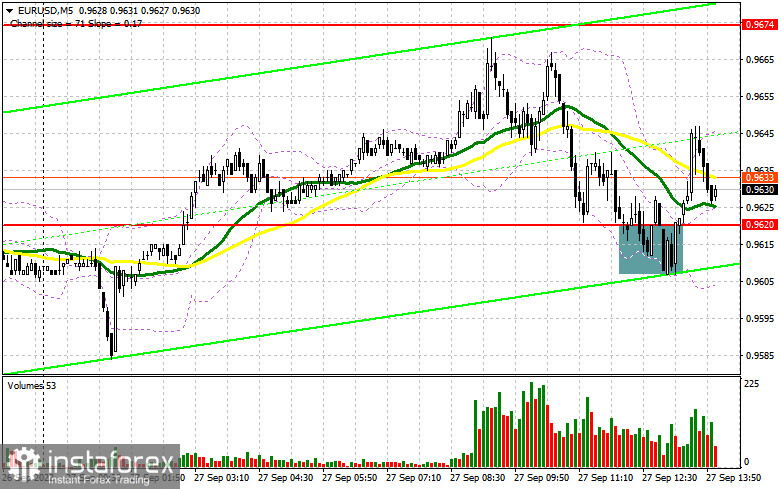
Conditions for opening long positions on EUR/USD:
As long as trading is carried out above 0.9610, the euro is likely to extend gains. The euro may continue to recover even after the hawkish statements of ECB President Christine Lagarde. She is going to deliver a speech this afternoon. The US is also scheduled to release some economic reports which could stir up volatility. It is recommended to pay attention to the Consumer Confidence Index for September, which could trigger a decline in the pair. Traders will also take notice of the New Home Sales report. A weak reading will indicate that the US economy is sliding into recession. The speech of Fed Chairman Jerome Powell is unlikely to significantly affect market sentiment although it may bolster the US dollar. If the pair declines, it is better to open long positions after a false breakout of the support level of 0.9610. It will give a good entry point in long positions with the prospect of a rise to 0.9662, which was formed in the first half of the day. Consolidation above this level and a downward test may help bulls regain momentum, providing a buy signal. If so, the price could reach 0.9715. A more distant target will be the 0.9770 level where I recommend locking in profits. If EUR/USD drifts lower after the hawkish statements of Fed officials and bulls show no activity at 0.9610, the pair will quickly slide down to the yearly low of 0.9558. At this level, it would be wise to open long positions only after a false breakout. You can open long positions on EUR/USD immediately at a bounce from a yearly low of 0.9509 or 0.9468, keeping in mind an upward intraday correction of 30-35 pips.
Conditions for opening short positions on EUR/USD:
Bears tried to regain the upper hand but failed. However, it does not change the main trend in the market. The longer the pair is trading below 0.9700, the more likely the bear market will persist. The pressure on the pair will escalate considerably if the US fresh turns out to be better than expected. The optimal scenario for opening short positions will be a false breakout of the nearest resistance level 0.9662 where the moving averages are passing in the negative territory. It will give a sell signal with a possible decline to 0.9610. Bulls and bears are unlikely to tussle for 0.9610 after another test. However, everything will depend on the US data. Positive reports will help bears tighten their grip. After a breakout of 0.9610, the pair is likely to decrease. An upward test will generate an additional sell signal. It will force bulls to close Stop Loss orders. So, the price may fall to a low of 0.9558. A more distant target will be the support level of 0.9505 where I recommend locking in profits. If EUR/USD climbs during the US session and bears show no energy at 0.9662, the euro may advance to 0.9715. It is better to open short only after a false breakout takes place. It will provide a new sell signal. You can sell EUR/USD at a bounce from a high of 0.9770 or 0.9813, keeping in mind a downward intraday correction of 30-35 pips.
. 
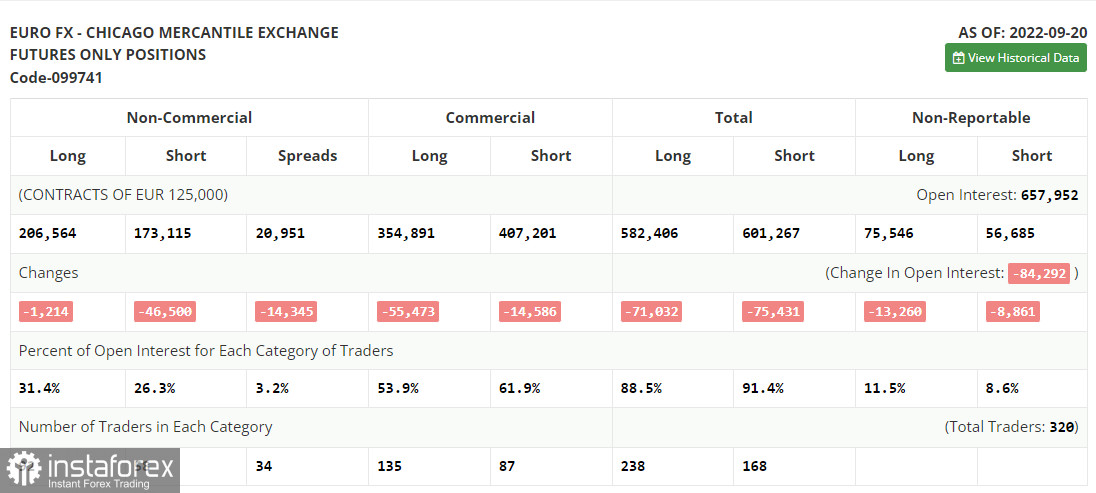
COT report
The COT report for September 20 logged a drop in both long and short positions. The data reflects the ECB's meeting in September and a sharp rise in the key interest rate of 0.75%. However, the Fed's meeting took place a bit later and failed to affect the report. Notably, the Federal Reserve also raised the benchmark rate by 75 basis points and maintained the gap between the interest rates of the central banks. As a result, pressure on the euro increased. In general, the current economic situation in the eurozone is affecting the euro, which has already dropped to 0.95 and has no reason to recover. A worsening geopolitical situation in the world has a significant influence on the eurozone. It may greatly slacken the European economy in autumn and winter. Against the backdrop, the economy may slip into recession as early as spring of 2023. That is why in the mid-term, the euro will hardly gain in value. Even though the US publishes weak fundamental data, investors will still prefer safe-haven assets, including the greenback. The COT report unveiled that the number of long non-commercial positions dropped by 1,214 to 206,564, whereas the number of short non-commercial positions slumped by 46,500 to 173,115. At the end of the week, the total non-commercial net position became positive and increased from -11,832 to 33,449. This indicates that investors have benefited from the situation and continued to buy the cheap euro, thus accumulating long positions. They hope that the crisis will end soon. The weekly closing price rose to 1.0035 from 0.9980.
Signals of technical indicators
Moving averages
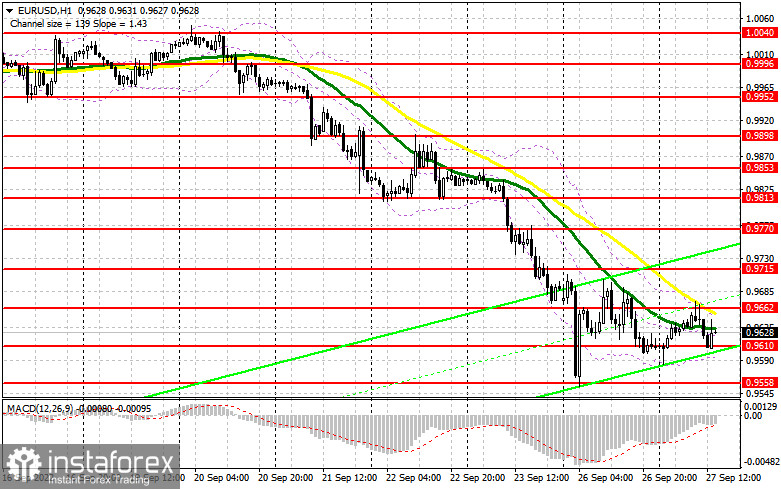
EUR/USD is trading below 30- and 50-period moving averages, indicating a further drop.
Remark. The author is analyzing the period and prices of moving averages on the 1-hour chart. So, it differs from the common definition of classic daily moving averages on the daily chart.
Bollinger Bands
If the EUR/USD pair rises, the indicator's upper border at 0.9662 will act as resistance.
Definitions of technical indicators
- Moving average recognizes an ongoing trend through leveling out volatility and market noise. A 50-period moving average is plotted yellow on the chart.
- Moving average identifies an ongoing trend through leveling out volatility and market noise. A 30-period moving average is displayed as the green line.
- MACD indicator represents a relationship between two moving averages that is a ratio of Moving Average Convergence/Divergence. The MACD is calculated by subtracting the 26-period Exponential Moving Average (EMA) from the 12-period EMA. A 9-day EMA of the MACD called the "signal line".
- Bollinger Bands is a momentum indicator. The upper and lower bands are typically 2 standard deviations +/- from a 20-day simple moving average.
- Non-commercial traders - speculators such as retail traders, hedge funds and large institutions who use the futures market for speculative purposes and meet certain requirements.
- Non-commercial long positions represent the total long open position of non-commercial traders.
- Non-commercial short positions represent the total short open position of non-commercial traders.
- The overall non-commercial net position balance is the difference between short and long positions of non-commercial traders.