 English
  Русский
 Bahasa Indonesia
 Bahasa Malay
 ไทย
ไทย Español
 Deutsch
 Български
 Français
 Tiếng Việt
 中文
中文 বাংলা
বাংলা हिन्दी
 Čeština
 Українська
 Română

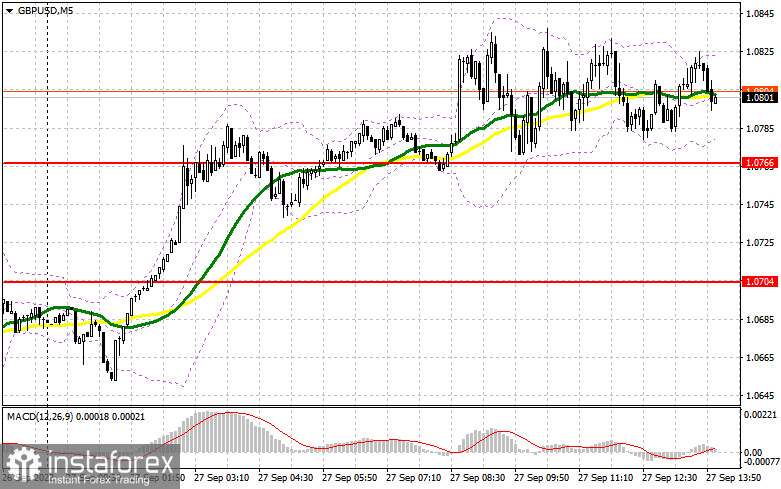
The sharp decline in pound volatility has seriously affected the market situation. In my morning forecast, I paid attention to the 1.0766 level and recommended making decisions on entering the market from it. Let's look at the 5-minute chart and figure out what happened. The decline of the GBP/USD pair occurred at the beginning of the European session, but we fell just a couple of points short of 1.0766 – fundamental statistics were not enough. For this reason, getting an entry point into the market was impossible.
To open long positions on GBP/USD, you need:
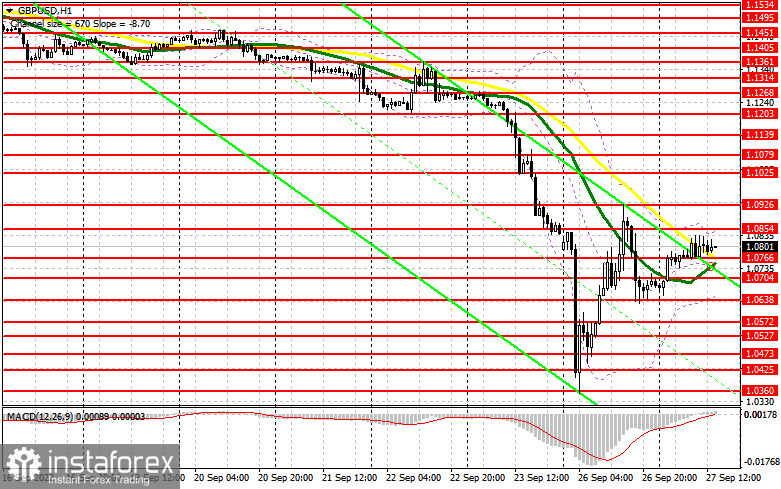
Today, during the American session, I advise you to pay attention to various statistics on the United States. We are talking about the consumer confidence indicator for September of this year. It may lead to a sharp decline in the pair, as well as the volume of home sales in the primary market. A weak indicator will indicate that the US economy is sliding further into recession, which may limit the further downward potential of the pound and lead to a sharp upward jerk of the pair. Data on changes in the volume of orders for long-term goods will also be considered by the market. In the case of a decline in GBP/USD in the afternoon, the optimal scenario for buying remains the formation of a false breakdown in the area of 1.0766, where the moving averages are playing on the buyers' side. This will give an excellent entry point to return to 1.0854. Only after getting above this range will it be possible to talk about building a further upward correction for the pair. A breakdown of 1.0854 and a reverse test from top to bottom will open the way to 1.0926, making it more difficult for buyers to control the market. A more distant target will be the 1.1025 area, leading to a fairly large market capitulation of sellers. I recommend fixing profits there. If GBP/USD falls against the background of hawkish statements by Federal Reserve Chairman Jerome Powell and the absence of buyers at 1.0766, the pressure on the pound will return. If this happens, I recommend postponing long positions to 1.0704 and 1.0638. I advise you to buy there only on a false breakdown. It is possible to open long positions on GBP/USD immediately for a rebound from 1.0572, or in the area of the minimum of 1.0527 with the aim of correction of 30-35 points within a day.
To open short positions on GBP/USD, you need:
Protecting the nearest resistance of 1.0854 remains an important task for the second half of the day. As I said this morning, bears should not release the pair beyond this range, as this may provoke new purchases, allowing bulls to strengthen their position in the market after the observed large sell-off. If the pair grows, only the formation of a false breakdown at 1.0854 will put pressure on the pound and form a sell signal based on a new development of the bearish trend and a decline to the nearest support of 1.0766. A breakthrough and a reverse test from the bottom up of this range, which could not be done during the European session, will give an entry point to sell with a fall to a minimum of 1.0704. Still, a much more interesting target will be the area of 1.0638, where the lower boundary of the future side channel can be formed, in which the pound will linger for a couple of weeks. I recommend fixing profits there. With the option of GBP/USD growth and the absence of bears at 1.0854, the situation will return to the control of buyers, albeit only for a while, which will lead to a return to 1.0926. A false breakout at this level forms an entry point into short positions in the expectation of a new downward movement of the pair. If there is no activity, there may be a jerk up to a maximum of 1.1025. I advise you to sell GBP/USD immediately for a rebound, counting on the pair's rebound down by 30-35 points within a day.
Signals of indicators:
Moving Averages
Trading is conducted above the 30 and 50-day moving averages, indicating the bulls' attempt to build a correction.
Note: The period and prices of moving averages are considered by the author on the hourly chart H1 and differ from the general definition of the classic daily moving averages on the daily chart D1.
Bollinger Bands
In case of growth, the upper limit of the indicator around 1.0854 will act as resistance.
Description of indicators
- Moving average (moving average determines the current trend by smoothing out volatility and noise). Period 50. The graph is marked in yellow.
- Moving average (moving average determines the current trend by smoothing out volatility and noise). Period 30. The graph is marked in green.
- MACD indicator (Moving Average Convergence / Divergence - moving average convergence/divergence) Fast EMA period 12. Slow EMA period 26. SMA period 9
- Bollinger Bands (Bollinger Bands). Period 20
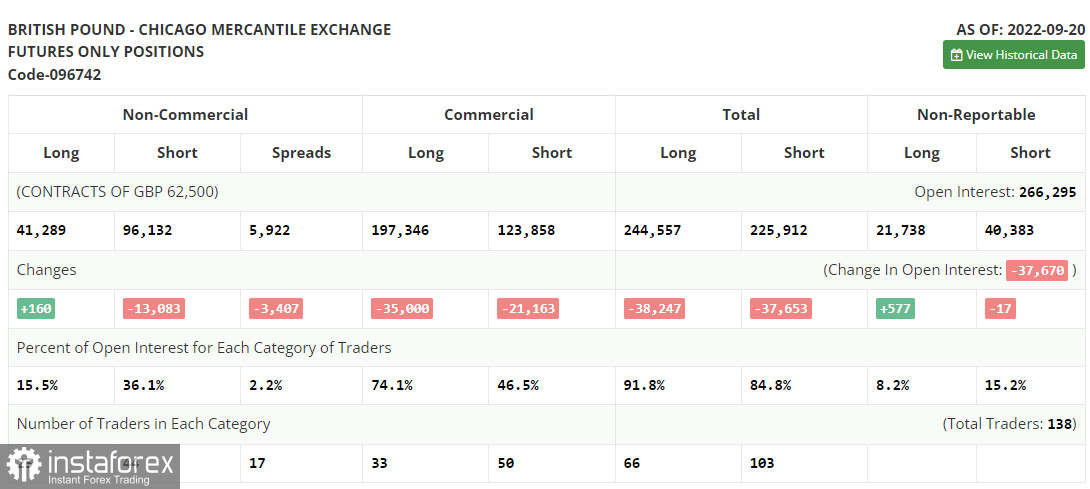
- Non-profit speculative traders, such as individual traders, hedge funds, and large institutions use the futures market for speculative purposes and to meet certain requirements.
- Long non-commercial positions represent the total long open position of non-commercial traders.
- Short non-commercial positions represent the total short open position of non-commercial traders.
- Total non-commercial net position is the difference between the short and long positions of non-commercial traders.