 English
  Русский
 Bahasa Indonesia
 Bahasa Malay
 ไทย
ไทย Español
 Deutsch
 Български
 Français
 Tiếng Việt
 中文
中文 বাংলা
বাংলা हिन्दी
 Čeština
 Українська
 Română

EUR/USD 5M
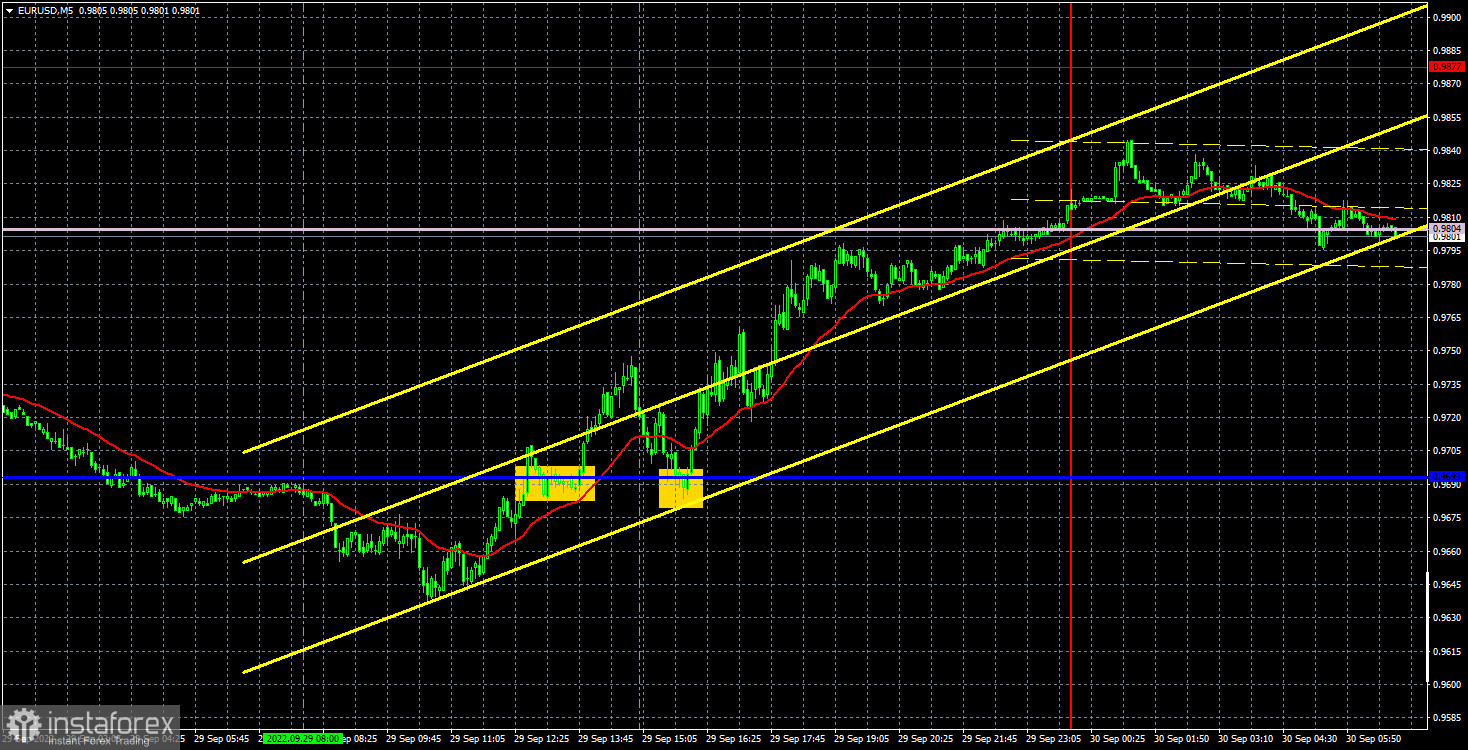
The euro/dollar was again trading very volatile and growing for no apparent reason on Thursday. From our point of view, this is a very positive moment for the euro, as this currency showed a convincing growth for the first time in a long time, which can now turn into a new upward trend. Better yet, traders were buying euros at a time when there were no fundamental or macroeconomic reasons to do so. And even more so geopolitical. This may indicate that the bears have had enough of selling and are now leaving the market. The rollback from the achieved 20-year lows is quite fast, sharp and strong, which also speaks in favor of the beginning of a new trend. In addition, the price managed to consolidate above the important lines of the Ichimoku indicator. Thus, now we could say that for some time the euro has gone into growth. Of course, the situation on the markets is now so unstable that the fall can resume at any moment, especially if new disappointing geopolitical news arrives. Nevertheless, if the growth continues today, this will be a strong step forward for the euro.
In regards to Thursday's trading, everything was in order. The movement was again almost one-way and strong. Two buy signals were formed when breaking and rebounding from the critical line. The first one was closed by Stop Loss, as the pair managed to go up only 40 points. The second brought a profit of at least 70 points, and the position had to be closed manually in the late afternoon, on the way to the Senkou Span B line.
COT report:
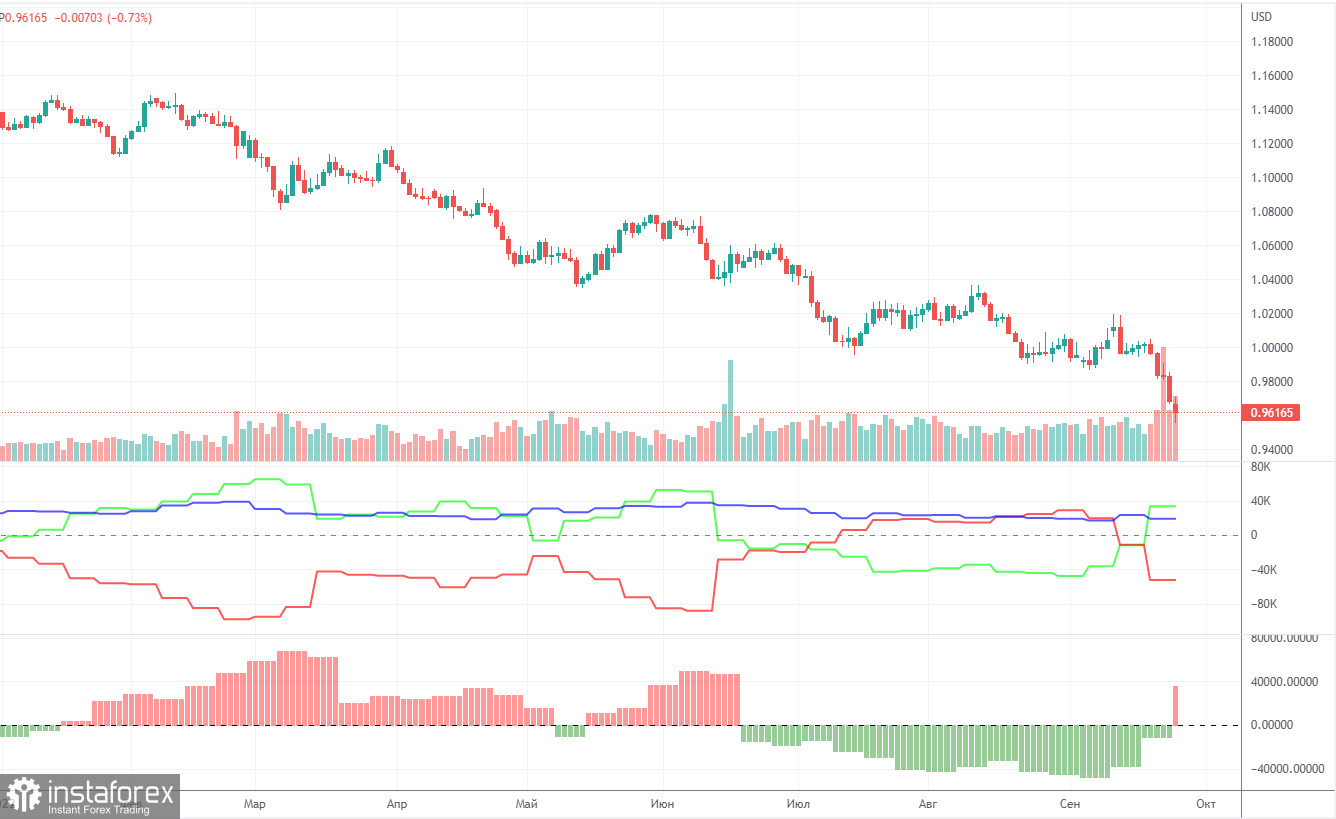
The Commitment of Traders (COT) reports on the euro in the last few months clearly reflect what is happening in the euro/dollar pair. For half of 2022, they showed a blatant bullish mood of commercial traders, but at the same time, the euro fell steadily. At this time, the situation is different, but it is NOT in favor of the euro. If earlier the mood was bullish, and the euro was falling, now the mood is bearish and... the euro is also falling. Therefore, for the time being, we do not see any grounds for the euro's growth, because the vast majority of factors remain against it. During the reporting week, the number of long positions for the non-commercial group increased by 2,500, while the number of shorts decreased by 22,000. Accordingly, the net position grew by about 24,500 contracts. This is quite a lot and we can talk about a significant weakening of the bearish mood. However, so far this fact does not provide any dividends to the euro, which still remains "at the bottom". The only thing is that in recent weeks it has done without another collapse, unlike the pound. At this time, commercial traders still do not believe in the euro. The number of longs is lower than the number of shorts for non-commercial traders by 12,000. This difference is no longer too large, so one could expect the start of a new upward trend, but what if the demand for the US dollar remains so high that even the growth in demand for the euro does not save the situation for the euro/dollar currency pair?
We recommend to familiarize yourself with:
Overview of the EUR/USD pair. September 30. We understand the reasons why the euro can resume its fall.Overview of the GBP/USD pair. September 30. The British pound, as usual, has a lot of problems.Forecast and trading signals for GBP/USD on September 30. Detailed analysis of the movement of the pair and trading transactions.EUR/USD 1H
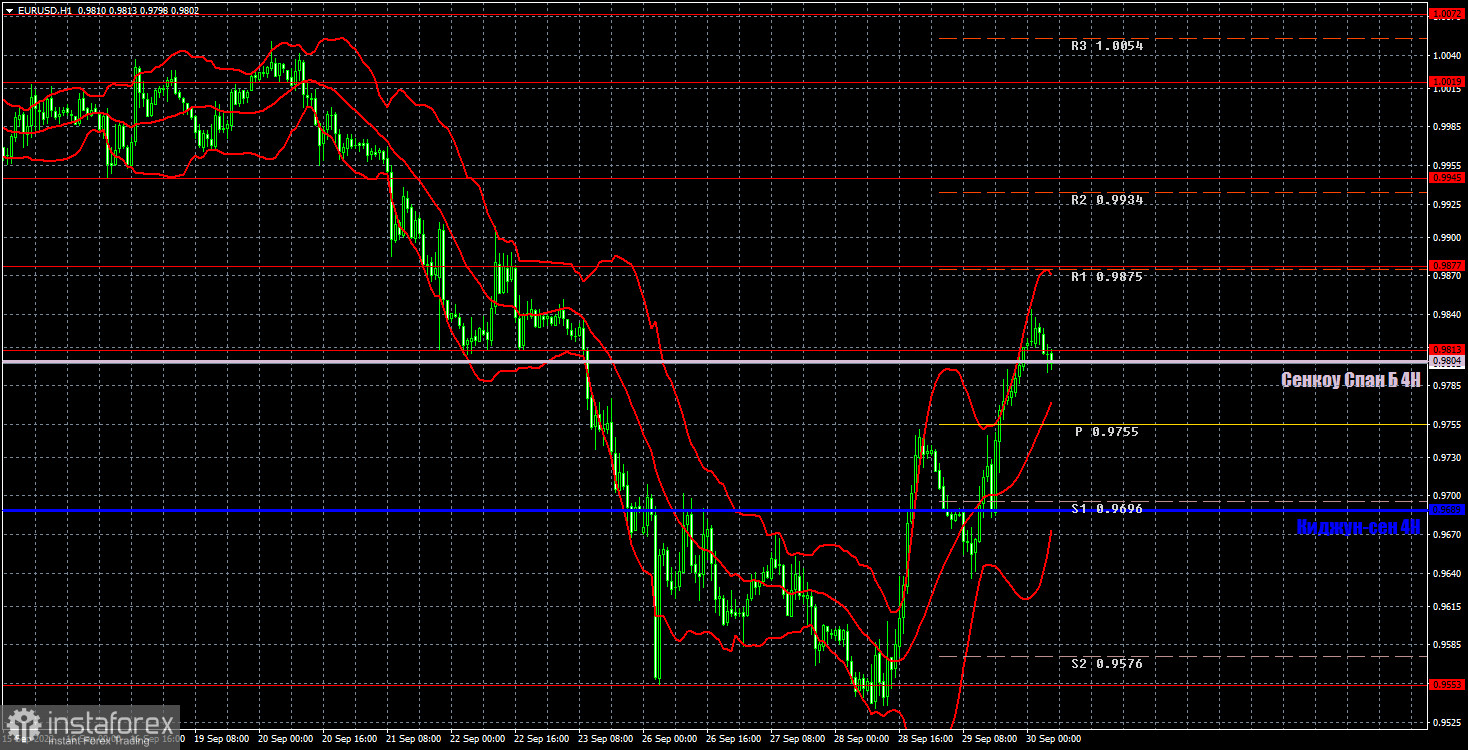
The trend has finally begun to change to an upward one on the hourly timeframe. Despite the fact that almost all types of backgrounds remain a failure for the euro, as well as the economic prospects of the European Union, the market still cannot sell the euro forever. Perhaps now we are entering a 2-3 month period of growth. The main thing is that the pair manages to stay above the Senkou Span B. We allocate the following levels for trading on Friday - 0.9553, 0.9813, 0.9877, 0.9945, 1.0019, as well as the Senkou Span B (0.9804) and Kijun-sen (0.9689). Ichimoku indicator lines can move during the day, which should be taken into account when determining trading signals. There are also secondary support and resistance levels, but no signals are formed near them. Signals can be "rebounds" and "breakthrough" extreme levels and lines. Do not forget about placing a Stop Loss order at breakeven if the price has gone in the right direction for 15 points. This will protect you against possible losses if the signal turns out to be false. The European Union will publish a report on inflation for September, which, according to experts, will grow to 9.7%. It is strange, but in the current circumstances, this report may support the euro, as it will further increase the likelihood of new European Central Bank rate hikes, and the market is now favorable to long positions on the euro.
Explanations for the chart:
Support and Resistance Levels are the levels that serve as targets when buying or selling the pair. You can place Take Profit near these levels.
Kijun-sen and Senkou Span B lines are lines of the Ichimoku indicator transferred to the hourly timeframe from the 4-hour one.
Support and resistance areas are areas from which the price has repeatedly rebounded off.
Yellow lines are trend lines, trend channels and any other technical patterns.
Indicator 1 on the COT charts is the size of the net position of each category of traders.
Indicator 2 on the COT charts is the size of the net position for the non-commercial group.